The break-even point formula is: Break-Even Point (Units) = Fixed Costs / (Sales Price per Unit – Variable Cost per Unit). That denominator is your contribution margin per unit. Divide your fixed costs by it and you get the minimum number of units you need to sell before you stop losing money.
That’s the whole calculation. The hard part is knowing your inputs well enough to trust the answer. This guide walks through the formula, the common variations, and two free break-even calculator templates you can download and use today: one for small businesses, one for rental property.
Free Break-Even Point Calculator (Google Sheets)
Two free templates. Click the link, make a copy, and enter your numbers in the blue cells. Everything else calculates automatically.
Both work in Excel too. Just download as .xlsx from the File menu once you’ve made your copy.
The Break-Even Point Formula
There are two versions of the break-even formula, depending on whether you want the answer in units or in revenue.
Break-even point in units:
Break-Even Units = Fixed Costs / (Selling Price per Unit − Variable Cost per Unit)
Break-even point in dollars:
Break-Even Revenue = Fixed Costs / Contribution Margin Ratio
The contribution margin ratio is the contribution margin per unit divided by the selling price. If you sell something for $20 and it costs you $8 to make, your contribution margin is $12 and your contribution margin ratio is 0.6 (or 60%).
A worked example. You sell a sandwich for $12. Ingredients, packaging, and card processing cost you $4. Your contribution margin is $8 per sandwich. Your fixed costs are $8,000 a month: rent, salaries, insurance, a loan payment. Divide $8,000 by $8 and you get 1,000. That’s your company’s break-even point. Sell 999 sandwiches and you lost money that month. Sell 1,200 and you cleared $1,600.
Same store, same math, in dollars. Contribution margin ratio is $8 / $12 = 0.667. Break-even revenue is $8,000 / 0.667 = $12,000 a month. Sell $12,000 in sandwiches and you’re at zero.
In Excel or Google Sheets
The formula in a spreadsheet is literally what it looks like on paper. If B2 is your fixed costs, B3 is your selling price, and B4 is your variable cost per unit:
=B2/(B3-B4)
For break-even revenue, divide your fixed costs by the contribution margin ratio:
=B2/((B3-B4)/B3)
Both templates below use these formulas inside a scenario table so you can see profit or loss across ten different sales volumes. If you want to back into a target selling price, Excel’s Goal Seek and Google Sheets’ Solver add-on will both do it. Point them at a cell containing your profit formula and tell them to make it equal zero.
What the Break-Even Point Actually Tells You
The break-even point is the level of total revenue at which your total costs are exactly covered. Below it, you’re losing money. Above it, you’re making some. It’s a floor, not a forecast.
Most businesses that fail were never profitable on paper. The numbers were always there. Nobody ran them. A break-even analysis is the first number you should know before you sign anything: a lease, a franchise agreement, a supplier contract, a purchase offer on a rental property.
Two numbers determine where your break-even point lands: your fixed costs and your contribution margin per unit.
Fixed costs don’t move with sales. Rent, salaries, insurance, loan payments, franchise fees. You owe those whether you open or not. Variable costs move with every sale. Cost of goods, packaging, payment processing, delivery commissions, sales commissions.
Contribution margin is what’s left over on each sale after variable costs. Every dollar of contribution margin goes toward covering fixed costs first. Once those are covered, every additional dollar becomes profit.
Free Break-Even Point Calculator (Business + Real Estate)
Two templates, same logic, different inputs. Enter your numbers in the blue cells. Everything else calculates automatically.
Business Calculator (Google Sheets)
Real Estate Calculator (Google Sheets)
Both files open in Google Sheets. Use File > Make a Copy to get your own editable version. Both also download cleanly as Excel files if you prefer.
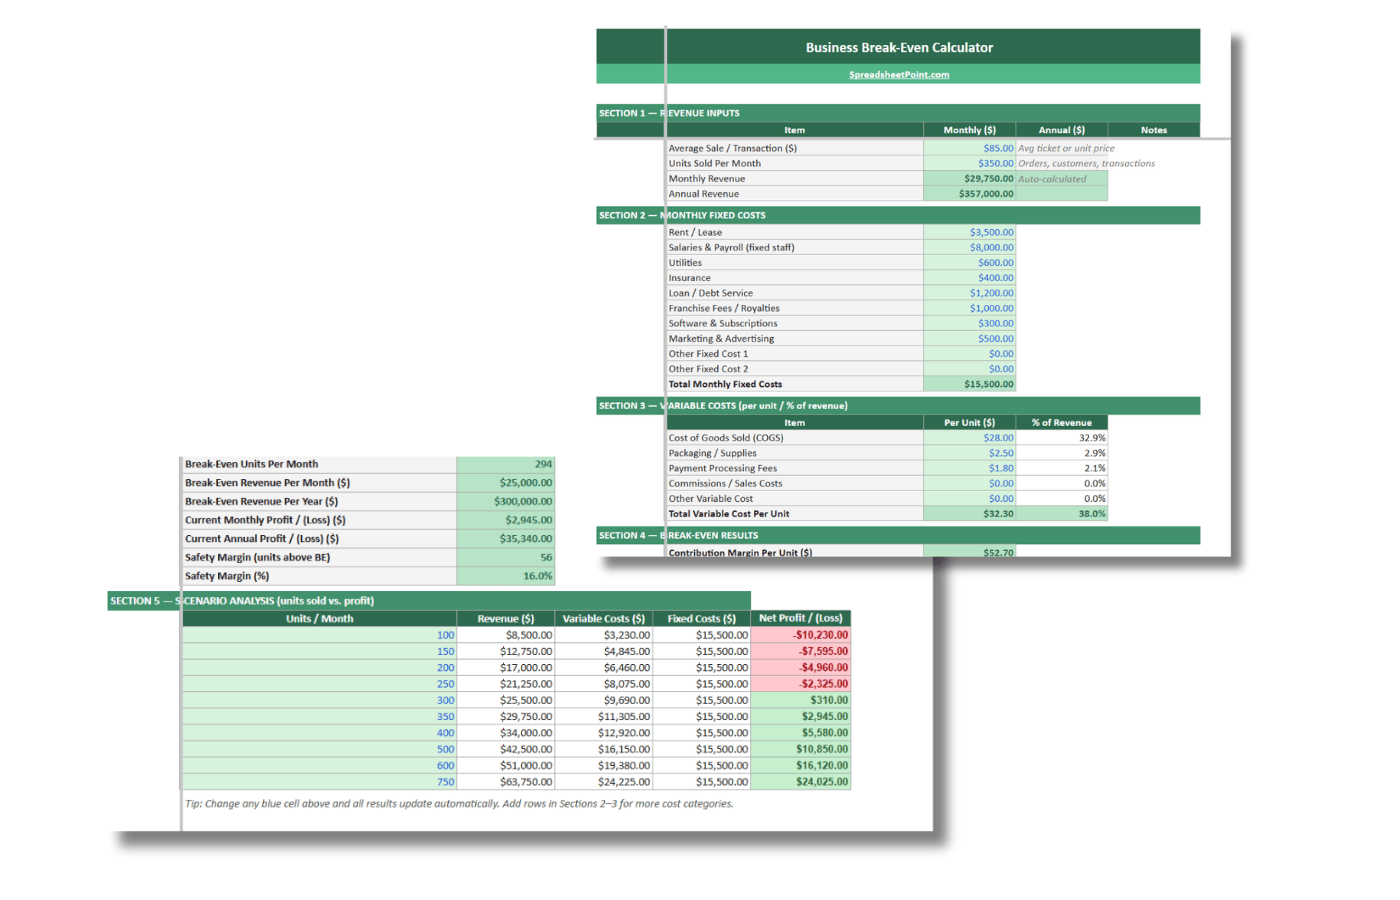
How to Use the Business Break-Even Calculator
Five sections, top to bottom.
- Revenue inputs. Your average selling price and units sold per month. Monthly and annual revenue calculate from these.
- Fixed costs. Ten line items including rent, salaries, utilities, insurance, debt service, franchise fees, software, and marketing. Zero out anything that doesn’t apply.
- Variable costs. Cost per unit for COGS, packaging, payment processing, and commissions. The template also shows each as a percentage of your sale price so you can see which line is eating your margin.
- Results. Break-even units per month, break-even revenue, current profit or loss, and your safety margin in both units and percentage.
- Scenario table. Cash flow across ten different sales volumes. Green means profitable. Red means losing money.
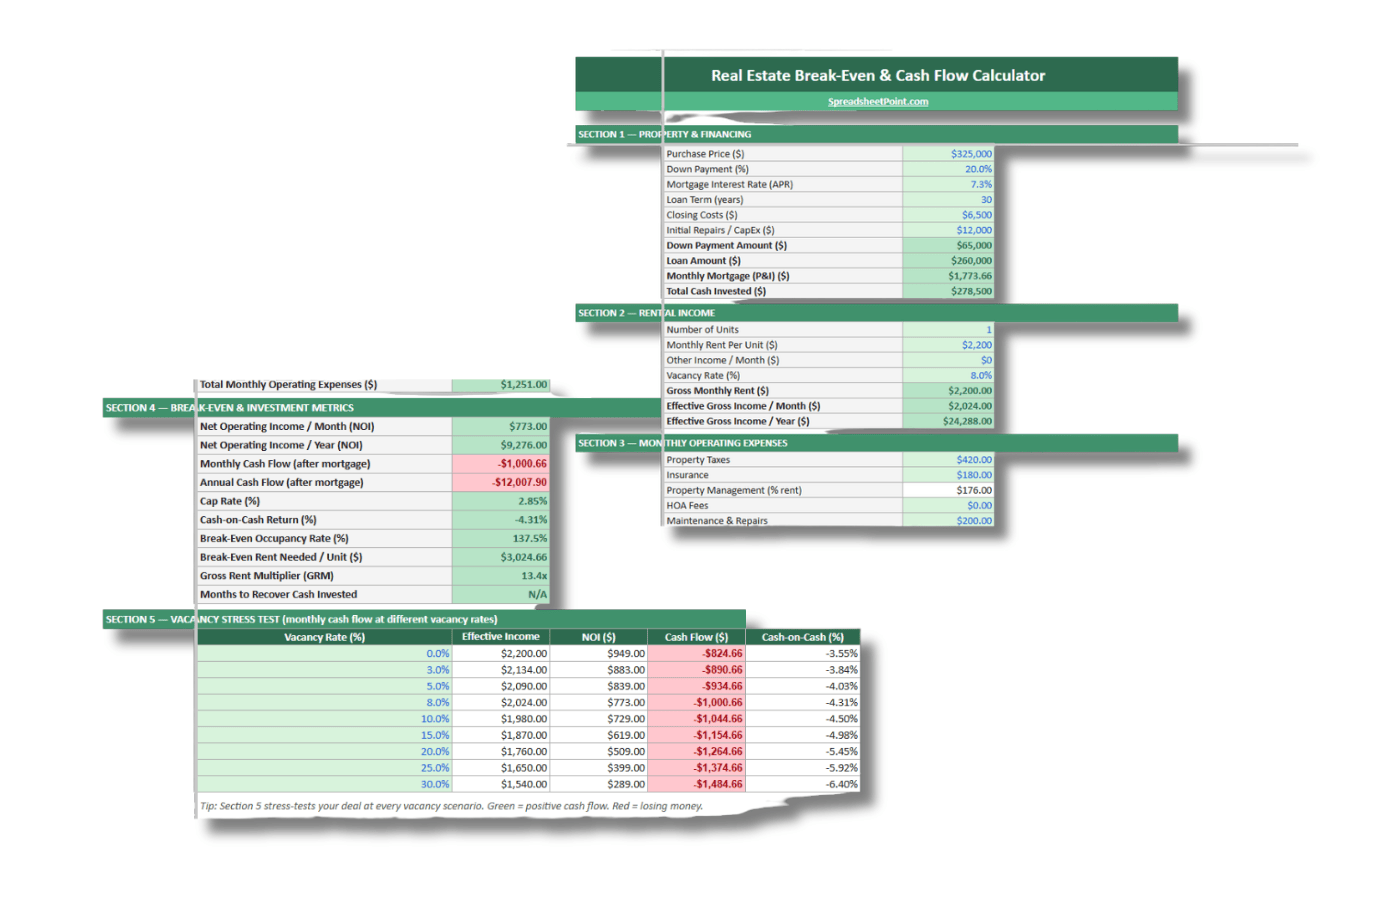
How to Use the Real Estate Break-Even Calculator
Same five-section layout, adjusted for a rental property.
- Property and financing. Purchase price, down payment, interest rate, loan term. Monthly mortgage payment calculates from these.
- Rental income. Number of units, rent per unit, other income, and vacancy rate. Effective gross income calculates from these.
- Operating expenses. Nine line items including property taxes, insurance, property management, maintenance, CapEx reserves, and utilities. Property management defaults to 8% of rent.
- Investment metrics. NOI, monthly and annual cash flow, cap rate, cash-on-cash return, break-even occupancy rate, break-even rent per unit, gross rent multiplier, and months to recover your initial cash investment.
- Vacancy stress test. Cash flow and cash-on-cash return at nine vacancy rates from 0% to 30%. Green means cash flow positive. Red means negative.
The Three Inputs You Need to Get Right
The formula is simple. The accuracy of your answer depends entirely on the accuracy of your three inputs.
1. Fixed costs, including the ones that are easy to miss
Most people undercount fixed costs the first time they do this. Rent is obvious. Salaries are obvious. The ones that slip through: software subscriptions, merchant account minimums, insurance riders, debt service on an acquisition loan, and franchise royalties.
If you bought a franchise, that royalty line is significant. A $1,000-a-week royalty is $4,333 a month in fixed costs before you’ve paid a single employee. That alone moves your break-even point by hundreds of units depending on your margin.
List everything that shows up whether you open or not. That’s your fixed cost number.
2. Variable cost per unit
Variable costs scale with sales. COGS is the obvious one. Add anything else that grows with each transaction: packaging, payment processing fees, delivery commissions, sales commissions.
Get this number wrong and your contribution margin is wrong. And if your contribution margin is wrong, your break-even calculation is wrong. The whole model is only as good as this input.
3. Average selling price
Use your actual average, not your menu price. If you run promotions, take the blended average. If you have multiple products, use the weighted average across your sales mix.
Optimistic pricing assumptions are one of the most common ways break-even analysis misleads people. Run it on your real average ticket, not the number that makes the math feel better.
The Target Profit Variation
Same formula, one addition. If you need a specific profit number, add it to your fixed costs before you divide.
Units for Target Profit = (Fixed Costs + Target Profit) / Contribution Margin per Unit
Same sandwich shop. $8,000 fixed costs, $8 contribution margin. Want to clear $5,000 a month in profit? You need $13,000 / $8 = 1,625 sandwiches. That’s 625 more than break-even. This is the number most operators actually care about, because nobody’s goal is to break even.
The Safety Margin
Knowing your break-even point is useful. Knowing how far above it you’re operating is more useful.
The safety margin is the gap between your current sales volume and your break-even point. If you need to sell 1,000 units to break even and you’re selling 1,400, your safety margin is 400 units, or about 29%.
That 400-unit buffer is what absorbs a slow month, a bad week, or a competitor opening nearby. A business with a 5% safety margin is one bad quarter away from a hard decision. A business with a 40% safety margin has room to maneuver.
When you’re evaluating a business to buy, the seller’s stated revenue matters less than where that revenue sits relative to break-even. A business doing $30,000 a month with $28,000 in fixed costs is fragile regardless of what the income statement says.
Break-Even for a Service Business
Same formula, different meaning for “units.”
For a consultant, a unit is a billable hour or a client engagement. For an agency, it’s a retainer. For a cleaner, it’s a job. Fixed costs are still fixed costs. Contribution margin is whatever’s left after the variable cost of delivering the service: subcontractor fees, travel, materials, software seats that scale with client count.
If your fixed overhead is $12,000 a month and your contribution margin on a typical retainer is $2,000, you need six retainers to break even. Seven gets you $2,000 in profit. The math is identical.
Break-Even for Real Estate Investors
Rental property break-even analysis works differently from a business, but the question is the same: at what point does this stop losing money?
For real estate, there are two versions of that question.
- Break-even occupancy rate. What percentage of the time does this unit need to be occupied to cover all expenses, including the mortgage?
- Break-even rent. What’s the minimum monthly rent needed to cover operating costs and debt service?
Both matter before you close. If break-even occupancy is 92% in a market where vacancy runs 15%, the deal depends on getting lucky every month. If break-even rent is $2,100 and comparable units are renting for $1,900, the deal doesn’t work at current market rents.
The numbers that go into a rental property break-even
On the cost side: mortgage principal and interest, property taxes, insurance, property management fees (usually 8% to 10% of collected rent), maintenance, capital expenditure reserves, and any HOA or utility costs you’re covering.
On the income side: gross rent, adjusted for vacancy. An 8% vacancy assumption is reasonable for most stable markets. Use the actual vacancy rate for the specific property or area if you have it.
Net Operating Income (NOI) is gross effective income minus operating expenses, before the mortgage. Cap rate is annual NOI divided by purchase price. Cash-on-cash return is annual cash flow after the mortgage divided by your total cash invested.
Most investors focus on cash flow. Break-even occupancy is the number that tells you how much margin for error you have.
Vacancy stress testing
Run the numbers at 0%, 5%, 10%, 15%, 20%, and 25% vacancy before you buy. Most deals that look fine at 5% vacancy look very different at 15%.
Markets shift. Tenants leave. Properties sit. If a deal only works at near-full occupancy, it’s a bet on things staying smooth. Those bets go wrong at inconvenient times.
Limitations of Break-Even Analysis
Break-even is a static model. It tells you what the math looks like today at a given cost structure and price. It doesn’t account for seasonality, growth, or cost increases over time.
Run it monthly if you’re in a business with seasonal swings. A pizza shop that breaks even on an annual average might be losing $8,000 a month in January and making $15,000 in July. The average hides the problem. The monthly view shows it.
For acquisitions, ask for 12 to 24 months of monthly sales data before you build the model. Sellers know how to present an annual average that looks healthy. Monthly data shows the variance. That variance is what you’re actually buying.
If you’re evaluating a franchise, pull the Franchise Disclosure Document before you run the numbers. Item 19 covers financial performance representations. Some franchisors publish average unit volumes. That’s your reality check on the revenue assumptions.
Related Spreadsheet Templates
- Google Sheets Profit and Loss Template — track the actual monthly expenses that feed into your fixed cost line.
- Business Expenses Spreadsheet — categorize fixed and variable costs so your break-even inputs are clean.
- Rental Property Spreadsheet — income, expense, and tenant tracking once you’ve closed the deal.
- Google Sheets Mortgage Calculator — useful for modeling the debt service side of a real estate deal.
- Loan Amortization Schedule — for any acquisition loan that’s feeding into your fixed costs.
- Cost of Buying a House Spreadsheet — closing-cost math to pair with the real estate break-even calculator.
- KPI Dashboard Template — safety margin is a KPI worth watching monthly.
Frequently Asked Questions
What is the break-even point formula?
The break-even point formula is Fixed Costs divided by Contribution Margin per Unit, where contribution margin per unit equals the selling price minus the variable cost per unit. The result is the number of units you need to sell to cover all costs. For break-even in dollars, divide fixed costs by the contribution margin ratio (contribution margin per unit divided by selling price).
What is the break-even point?
The break-even point is the sales volume at which total revenue exactly equals total costs. Below that point, a business is losing money. Above it, it’s generating profit. It’s typically expressed as a number of units, a revenue amount, or an occupancy rate, depending on the context.
How do you calculate break-even point in Excel or Google Sheets?
Put fixed costs in one cell, selling price in a second, and variable cost per unit in a third. Then enter =FixedCosts/(SellingPrice-VariableCost) in a result cell. For break-even revenue instead of units, use =FixedCosts/((SellingPrice-VariableCost)/SellingPrice). Excel’s Goal Seek and the Google Sheets Solver add-on can also back into a required selling price or sales volume if you fix a target profit.
What is a contribution margin?
Contribution margin is what remains from a sale after variable costs are subtracted. If a product sells for $50 and costs $20 in variable costs to produce and deliver, the contribution margin is $30. That $30 contributes toward covering fixed costs. Once fixed costs are fully covered, additional contribution margin becomes profit.
What is the difference between break-even in units and break-even in dollars?
Break-even in units tells you how many items you need to sell. Break-even in dollars tells you how much revenue you need to generate. Both give you the same answer expressed two ways. Units works well for businesses with a single product or a clear average ticket. Dollars works better for service businesses, agencies, or operations with a wide mix of prices where a single unit count isn’t meaningful.
What is a good break-even occupancy rate for rental property?
A break-even occupancy rate below 70% is generally considered a comfortable margin of safety for a long-term rental property. That means the property covers all expenses, including the mortgage, even with 30% vacancy. Deals that require 85% or higher occupancy to break even carry meaningful risk in most markets, where vacancy rates can shift substantially during soft periods or tenant turnover.
How does break-even analysis help when buying a business?
Break-even analysis on an acquisition shows the minimum sales volume required to cover all costs at the new ownership structure, including any acquisition debt. It lets a buyer compare the seller’s claimed revenue against what’s actually needed to survive. If a business is operating near break-even at current revenue, a small sales decline after the transition can create cash flow problems fast.
What is a safety margin in break-even analysis?
The safety margin is the difference between current sales volume and the break-even point. A business selling 1,400 units per month with a break-even point of 1,000 units has a safety margin of 400 units, or about 29%. A larger safety margin means more cushion to absorb slow periods, competitive pressure, or cost increases without falling below profitability. It’s one of the most useful numbers in small business financial planning.
Can I use the break-even calculator for a service business?
Yes. For a service business, a unit can represent a billable hour, a client engagement, or a monthly retainer. The principle is the same: identify fixed costs, determine the revenue or margin per client or hour, and calculate how many are needed to cover the fixed cost base. The business break-even template works for service businesses with minor adjustments to the variable cost and revenue input fields.