Google Sheets calculates standard deviation with a single built-in function. Type =STDEV(), select your range, and the result appears instantly. No manual formulas, no statistics background required.
This guide covers every variation of the STDEV function in Google Sheets, including how to handle multiple datasets, filtered data, and when to use each member of the broader standard deviation function family.
You can download a copy of the example sheet to follow along.
What Is Standard Deviation?
Standard deviation tells you how spread out the numeric values in a dataset are relative to the dataset’s mean. The closer the data points cluster around the mean, the lower the standard deviation. The more scattered they are, the higher it is.
Take a class of 50 students with a mean exam score of 70. A standard deviation of 10 means most scores fall between 60 and 80. A standard deviation of 25 means scores are spread much further from that 70 average, possibly ranging from very low to near the maximum possible score.
- A low standard deviation means most data points sit close to the dataset’s mean.
- A high standard deviation means data points are spread far from the mean, or outliers are pulling the distribution wider.
Standard deviation is calculated as the square root (sqrt) of the variance. Variance measures the average of the squared differences between each value and the mean. Google Sheets computes both steps for you automatically, so you never need to work through this manually.
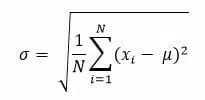
- μ is the mean
- Σ means the sum of
- Xi is the value of each item in the list
- N is the total number of values in the dataset
Understanding the formula is useful context, but you do not need it to use STDEV in Google Sheets.
STDEV Formula Syntax
The STDEV function takes your dataset as the input and returns the standard deviation value.
=STDEV(arguments)
The value arguments can be any of the following:
- A range of cells, such as B2:B6
- A set of individual values typed directly into the formula
- Individual cell references
- A combination of ranges and additional values
- A filtered set of values using a nested FILTER function
STDEV requires at least two numeric values to return a result. With fewer than two values, it returns a #DIV/0! error.
How to Calculate Standard Deviation in Google Sheets
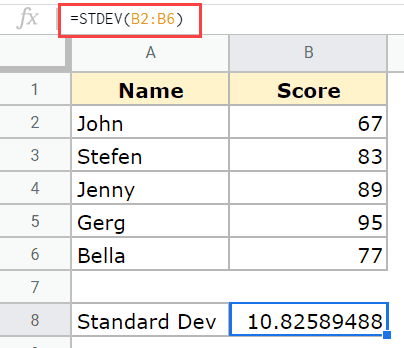
Suppose you have the following dataset of student scores and want to find the standard deviation.

Enter this formula in an empty cell:
=STDEV(B2:B6)
You can also enter values directly if you only have a few to work with:
=STDEV(67,83,89,95,77)
Or reference individual cells when your data sits in non-contiguous locations:
=STDEV(B2,B3,B4,B5,B6)
You can also combine a range with additional values or individual cell references in the same formula:
=STDEV(B2:B5,B6)
Calculating Standard Deviation Across Multiple Columns
When your dataset spans multiple columns, STDEV works exactly the same way. Calculate each column separately using the same formula pattern.

Start with the Math column:
=STDEV(B2:B6)

Then drag the small blue handle at the bottom right of the cell across to the remaining columns. Google Sheets adjusts the column reference automatically.

Calculating Standard Deviation With a Condition
To calculate standard deviation on a filtered subset of data, nest a FILTER function inside STDEV. This lets you apply a condition before the calculation runs, so only the qualifying numeric values feed into the result.
=STDEV(FILTER(range, condition))
To find the standard deviation for only those students who scored above 70:
=STDEV(FILTER(B2:B6,B2:B6>70))
The FILTER function returns only the values that meet the condition, and STDEV calculates the spread across that filtered group. This approach is useful any time you need standard deviation for a segment of your data rather than the full dataset.
STDEV vs STDEVP: Sample vs Population
Choosing between STDEV and STDEVP is the most important decision in this function family, and picking the wrong one produces incorrect results.
STDEV calculates standard deviation for a sample, meaning a subset drawn from a larger group. It uses n-1 in the denominator (Bessel’s correction), which adjusts for the fact that a sample tends to underestimate the spread of the full population. Use STDEV when your dataset represents a selection of cases rather than every case.
STDEVP calculates standard deviation for an entire population, meaning every member of the group is in your dataset. It divides by n rather than n-1. Use STDEVP when you have complete data and no sampling is involved.
A practical example: if you have exam scores for 50 students out of a school of 500, use STDEV. If you have scores for every student in the school with no one missing, use STDEVP.
The same logic applies when working with variance. The VAR function calculates the variance of a population sample, while VARP calculates the variance of an entire population. Standard deviation is simply the sqrt of variance, so STDEV and VAR are closely related, as are STDEVP and VARP.
All Standard Deviation Functions in Google Sheets
Google Sheets includes a full family of standard deviation and related statistical functions. Here is what each one does and when to use it.
STDEV
Calculates standard deviation for a sample. Ignores text values and blank cells. The function to reach for in most everyday use cases.
STDEVP
Calculates standard deviation for a complete population. Use when your dataset contains every member of the group with no omissions.
STDEVA
Works like STDEV but treats text values as 0 instead of ignoring them. Useful when your data includes dashes, the word “zero,” or other text placeholders you want counted as numeric values in the calculation.
STDEVPA
Combines the population calculation of STDEVP with the text-as-zero behavior of STDEVA. Use when you have a complete population dataset that includes text placeholders.
VARA
Calculates variance for a sample while treating text values as 0. The variance counterpart to STDEVA.
STDEV.S
Produces the same result as STDEV and exists for compatibility with Excel. The syntax is:
=STDEV.S(array)

STDEV.S is not recommended when your dataset contains fewer than 10 data points or when the data is not normally distributed.
DSTDEV and DSTDEVP
These are database functions that calculate standard deviation using a sql-like query structure. DSTDEV calculates for a sample and DSTDEVP calculates for a population. Both take three arguments: the full data range, the column to analyze, and a criteria range that filters the rows. Use DSTDEV and DSTDEVP when your data sits in a structured table and you want to filter by criteria defined in a separate range on the sheet.
DVAR and DVARP
The database variance counterparts to DSTDEV and DSTDEVP. DVAR returns the variance of a population sample from a database range meeting specified criteria. DVARP returns the variance of an entire population from a database range. Both follow the same sql-like query structure as the DSTDEV functions.
AVEDEV
Returns the average of the magnitudes of deviations from the dataset’s mean, also called mean absolute deviation. Where STDEV squares the differences before averaging them, AVEDEV uses absolute values instead. The result is expressed in the same units as your data, which can make it easier to interpret in some contexts. AVEDEV is more sensitive to outliers than standard deviation.
DEVSQ
Returns the sum of squared deviations from the dataset’s mean, which is the numerator of the variance formula before dividing by n. Useful when you need an intermediate step in a manual statistical calculation.
SKEW
Returns a value that describes the symmetry of that dataset around its mean. A positive skew value means the distribution has a longer tail to the right. A negative value means the tail extends further left. A value near zero indicates a roughly symmetrical distribution. Use SKEW alongside STDEV when you want to understand not just how spread out your data is, but whether that spread is balanced on both sides of the mean.
Rules for Using STDEV
- STDEV ignores text values and blank cells within the specified range. If every cell in your range contains text, the formula returns an error.
- STDEV calculates standard deviation for a sample. Use STDEVP for a complete population.
- The formula requires at least two numeric values. A single value returns a #DIV/0! error because standard deviation across one data point is undefined.
- Blank cells are excluded from the count automatically. A range of B2:B10 where B5 is empty treats that as eight values, not nine.
Formatting the STDEV Result
STDEV returns a number with several decimal places by default. To reduce the decimal display:
- Select the cell containing the result.
- Click Format in the menu bar.
- Hover over Number.
- Click Number.

This formats the result to two decimal places. To set a custom number of decimals, choose Custom number format from the same menu and enter the format code manually.
Related Google Sheets Guides
- How to Add Error Bars in Google Sheets
- How to Calculate Weighted Average in Google Sheets
- Z Score Google Sheets Guide
- Google Sheets Trace Dependents and Precedents
- Standard Error in Google Sheets
- Calculating Standard Deviation in Excel
- How to Make a Bell Curve in Google Sheets
Frequently Asked Questions
What is the STDEV formula in Google Sheets?
STDEV is a built-in Google Sheets function that calculates the standard deviation of a sample dataset. Enter =STDEV() in a cell and provide a range, individual values, or a combination of both as the argument. The function returns a single number representing how spread out the numeric values are relative to the dataset’s mean.
What is the difference between STDEV and STDEVP in Google Sheets?
STDEV calculates standard deviation for a sample, using n-1 in the denominator to correct for sampling bias. STDEVP calculates standard deviation for a complete population, using n as the denominator. Use STDEV when your data is a subset of a larger group. Use STDEVP when your dataset contains every member of the group you are analyzing with no omissions.
How do I calculate standard deviation for multiple columns in Google Sheets?
Enter the STDEV formula in a result row beneath the first column, then drag the fill handle across to apply the same formula to each additional column. Google Sheets adjusts the column references automatically as you drag. Each column returns its own standard deviation value independently.
Can I calculate standard deviation with a condition in Google Sheets?
Yes. Nest a FILTER function inside STDEV to apply a condition before the calculation runs. For example, =STDEV(FILTER(B2:B6,B2:B6>70)) returns the standard deviation only for values above 70. The FILTER function returns the qualifying numeric values first, then STDEV calculates across that filtered result.
Why is my STDEV formula returning a #DIV/0 error?
STDEV requires at least two numeric values to calculate. If your range contains fewer than two numbers, or if every cell in the range contains text or is blank, Google Sheets returns a #DIV/0! error. Check that your range includes at least two cells with numeric values and that the range reference is correct.
What is the difference between STDEV and STDEV.S in Google Sheets?
There is no functional difference. STDEV.S produces the same result as STDEV using the same sample calculation method. STDEV.S exists for compatibility with Microsoft Excel, which uses the STDEV.S naming convention. Either function works in Google Sheets. STDEV.S is not recommended for datasets with fewer than 10 values or data that is not normally distributed.
Does STDEV ignore blank cells and text values?
Yes. STDEV automatically ignores blank cells and text values within the specified range and calculates using only the numeric values present. If you want text values counted as 0 rather than ignored, use STDEVA instead. The total number of values STDEV counts is the number of numeric cells in the range, not the total number of cells.