Excel Tips
Practical Excel help you can trust, fast. This hub collects our most useful Excel guides on formulas, calculations, formatting, PivotTables, templates, and advanced features, all written step by step with clear examples and screenshots. Whether you are learning Excel basics or doing complex data analysis on sales data, the goal is the same, accurate results without wasting time hunting through the ribbon.
If you already know what you need, use the site search to jump straight to the right tutorial. If you are not sure where to start, use the sections below.
Start here
Pick the path that matches what you are trying to do right now. If you are staring at a single cell wondering what to type, start with calculations and excel functions, type your formula, then press Enter to run it.
- Write a formula or fix a calculation
- Work faster with shortcuts and quick tricks
- Clean up formatting or build a chart
- Summarize data with PivotTables
- Understand workbook basics and file handling
- Explore advanced features like Python in Excel
Excel workbook basics
An Excel workbook is the file, and it can contain multiple worksheets (tabs). If you collaborate with a team or move between devices, workbook basics matter as much as formulas. Getting the structure right also makes it easier to reuse a range of cells, keep column headers consistent, and avoid broken references later.
- Workbook vs worksheet, what changes when you copy or move sheets
- File types you will see most often, including .xlsx and .xls
- Safe sharing habits, like using clearly named versions and keeping source data separate from reports
- How to freeze panes so column headers stay visible while you scroll through data points
If you are downloading one of our templates into Excel, you will typically copy the sheet, then use File > Download and select the Excel option. Keep an eye out for feature differences if the template originated in Google Sheets. For workbooks that will be shared, keep number formatting consistent, especially commas for thousands in sales data, so readers interpret totals correctly.
Excel tricks and shortcuts
These guides are for speed, quality of life, and fewer clicks. If you work in Excel daily, shortcuts and small tricks usually deliver the biggest time savings. Many of the most-used commands live on the ribbon, but learning the keyboard equivalents is what makes Excel a powerful tool instead of a slow one.
- Excel keyboard shortcuts (including Windows Ctrl keys and Mac cmd shortcuts)
- Quick wins to learn next (paste special, fill handle habits, fast selection methods, freeze panes)
- Flash Fill tips for cleaning repeated patterns without writing formulas
- Calculate duration between dates with DATEDIF in Excel
- Comparing Excel files with Power Query
- Excel Macros (including when Visual Basic makes sense)
If you are not sure where a feature lives, check the Data tab for sorting, filtering, and refresh options, then use the ribbon search to jump to commands.
Excel calculations and formulas
We break down Excel formulas in a way that is easy to reuse. Every formula guide includes a syntactical breakdown, what each argument means, and what is optional. This approach helps you get accurate results, especially when you are running calculations across a large range of cells with thousands of data points.
Example syntax from our guide on IF contains partial text in Excel:
=IF(test, if-true, if-false)
From there, our tutorials walk through each argument with screenshots and real-world examples. If you are building calculations for workbooks that other people will maintain, this style helps you write excel functions that do not collapse later. In most cases, you will type the formula into a single cell, then press Enter, then copy it down the column if needed.
Popular formula and function guides:
- How to use the COUNTIF Excel function
- How to use the CHOOSE function in Excel
- How to use the NOT function in Excel
Common calculation problems, fast fixes
- If a formula returns #N/A, check whether a lookup value actually exists in your source range.
- If a formula returns #VALUE!, check for mixed data types, like text numbers that need conversion, or commas used inconsistently in imported numbers.
- If a formula returns 0 unexpectedly, confirm you are referencing the intended cells and not a blank range.
- If results look right but totals are wrong, confirm hidden rows, filters, and whether you are summing visible data only.
- If you are working with sales data, confirm your column headers match your assumptions, and that dates, currency, and IDs are stored consistently.
Excel formatting and data visualization
Formatting is where most spreadsheets either become readable or become a mess. We cover cleanup, table formatting, and practical dashboard design so your workbook stays usable. For quick scanning, visual tools like data bars can highlight the biggest data points without building a full chart.
Popular formatting and cleanup guides:
- How to remove dashes in Excel
- How to remove and edit table formatting in Excel
- How to swap cells
- How to find duplicates
If you are building a report, dashboards are usually the fastest way to turn raw data into decisions. We also cover graphs and charts, including how to keep labels readable and formats consistent as your workbook grows.
Excel pivot tables and data analysis
Pivot Tables are Excel’s fastest way to summarize large datasets without writing complex formulas. They are ideal when you need totals, counts, grouped summaries, or quick breakdowns by category, date, or owner. For complex data analysis, PivotTables often provide the cleanest route to accurate results, especially when you start with a well-structured range of cells and consistent column headers.
PivotTables, when to use them
- Use PivotTables when you need quick summaries and flexible slicing.
- Use formulas when you need row-level outputs that live beside your data.
- Use both when you want a PivotTable summary plus calculated fields outside the PivotTable for presentation.
PivotTables, common pitfalls
- Forgetting to refresh after source data changes (check the Data tab for Refresh All)
- Using a source range that does not include new rows, consider converting source data to a table first
- Date grouping behaving oddly when dates are stored as text
If your analysis involves frequent imports, cleanup, and repeatable transformations, you will often pair PivotTables with structured tables, consistent formatting, and clear column headers so your data points roll up correctly.
Advanced Excel, Python, and Copilot
Excel keeps evolving, and advanced features now overlap with analytics workflows that used to require separate tools. We publish guides and templates that reflect modern Excel use across desktop and cloud environments, from Power Query pipelines to Visual Basic automation when macros are still the simplest option.
One popular advanced topic is how to use Python in Excel. Python in Excel can unlock more advanced analysis inside the spreadsheet grid, but availability, compute limits, and licensing can vary by Microsoft 365 plan. If you are using Excel at work, confirm what your organization has enabled before you design a workflow around it.
Whether you need to modify a large dataset, audit formulas, build graphs, or clean up chart labels, our advanced Excel coverage is designed to be practical and repeatable.
Excel spreadsheet templates
Our team regularly creates spreadsheet templates that many readers use as Excel workbooks. A common workflow is to make a copy, then use File > Download and choose the Excel option.
This lets you start with a working structure instead of rebuilding from scratch. For example, you can use our financial planning templates, including budget templates, as a base and then adjust categories, formatting, calculations, and column headers to match your needs.
Note: if a template originated in Google Sheets, some features may behave differently in Excel depending on how the file was created and which Excel version you use.
A community of experts
We also publish tutorials and walkthroughs on YouTube, and we regularly respond to reader comments. If a guide helped you solve a real problem, share it with your team, and feel free to ask questions in the comments.
Excel tips FAQ
These quick answers cover the most common Excel questions readers ask, from workbook basics to PivotTables, formatting, and calculations.
What are the best Excel tips for beginners who feel overwhelmed?
Start with three habits: use tables for data (so ranges expand automatically), learn 10 core shortcuts (copy, paste, undo, fill, find, filter), and keep raw data separate from reports. A simple workbook structure, one data sheet, one analysis sheet, one dashboard sheet prevents chaos as files grow.What are the most useful Excel keyboard shortcuts I should learn first?
Focus on the ones that remove repeated mouse work: Ctrl+C, Ctrl+V, Ctrl+Z, Ctrl+F, Ctrl+H, Ctrl+Arrow to jump, Ctrl+Shift+Arrow to select, Ctrl+1 for formatting, Alt+= for AutoSum, Ctrl+T to format as a table. On Mac, learn the cmd equivalents for the same most-used commands. These unlock speed without memorizing dozens of combos.How do I speed up Excel when my workbook is slow or freezing?
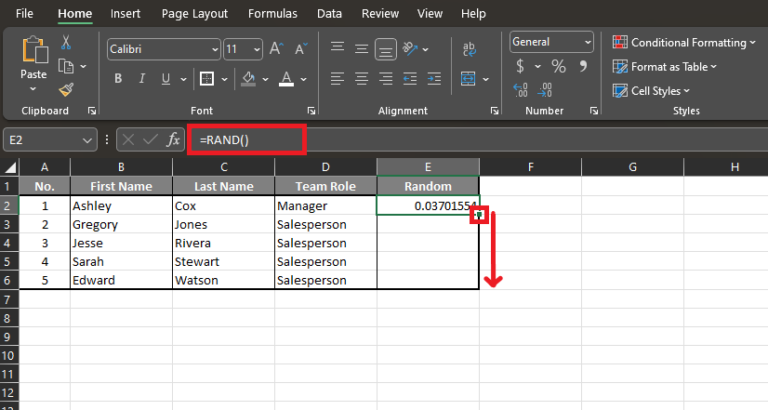
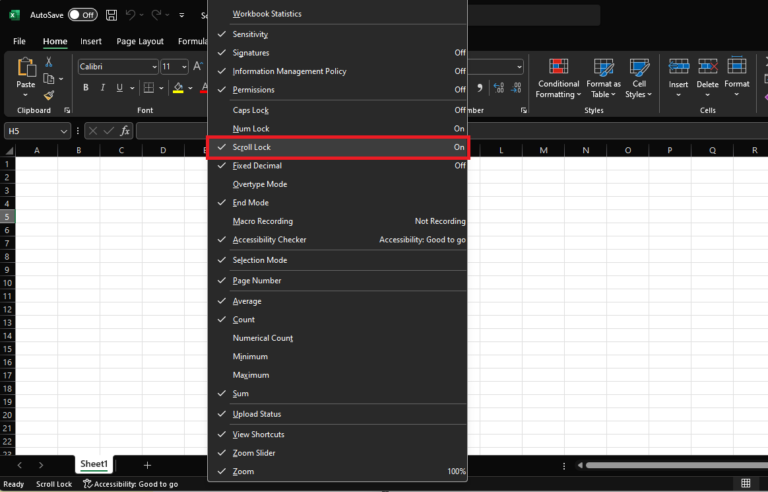
Reduce volatile formulas (like NOW, TODAY, RAND), limit full-column references (A:A) when possible, convert heavy ranges to Excel Tables, and avoid unnecessary conditional formatting across huge ranges. If the file is still slow, switch calculation to manual while editing, then calculate when needed for accurate results.How do I reduce an Excel file size without breaking formulas?
Delete unused rows and columns beyond your real data, remove excess formatting (especially on entire sheets), compress images, and clear unused named ranges. If you imported data from outside sources, check for hidden formatting and inconsistent commas in numeric fields that bloat the file. Save a copy before cleanup so you can revert if something was applied too aggressively.What’s the difference between a workbook and a worksheet in Excel?
A workbook is the file you save, like Report.xlsx. Worksheets are the tabs inside the workbook, like Data, Analysis, Dashboard. A single workbook can contain many worksheets, each with different roles.How do I organize a messy workbook so it’s easier to maintain?
Create a clear layout: one sheet for raw data, one for calculations, one for output. Rename sheets, keep column headers consistent, and add a small legend that explains inputs, assumptions, and refresh steps. Use freeze panes so headers stay visible while you scroll through data points.How do I quickly clean data in Excel before I start analyzing it?
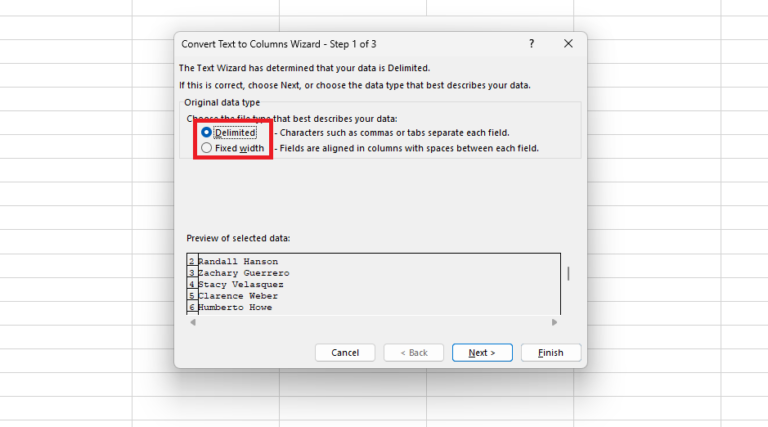
Start by converting the range of cells to a table (Ctrl+T), then standardize types: trim extra spaces, ensure dates are real dates (not text), and convert text numbers to numbers. Flash Fill can help clean repeated patterns fast, and data bars can help you spot outliers before you start deeper analysis.How do I remove duplicates in Excel without deleting the wrong rows?
First, decide what makes a record unique, usually a combination of column headers. Make a backup copy of the sheet, then use Remove Duplicates with only the columns that define uniqueness selected. If you need to keep the latest record per person or ID, sort by date descending first so the kept row is the one you want.How do I find duplicates in two columns in Excel?
Use conditional formatting with a formula that checks a combined key. For example, if A is Customer and B is Date, add a helper key in C with =A2&”|”&B2, then highlight duplicates in C using a duplicate rule. This avoids missing duplicates that only appear when both fields match.How do I swap cells, rows, or columns in Excel without messing up references?
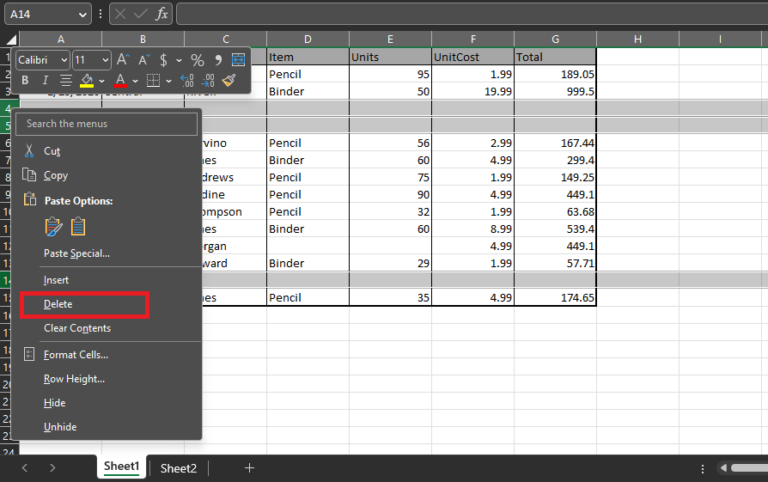
For rows or columns, select the entire row or column, then hold Shift while dragging the border to insert it in the new location. This preserves structure better than cut and paste in many cases. For a small swap of a range of cells, cut one range, insert cut cells, then move the other into the gap.How do I remove dashes from numbers in Excel while keeping the values correct?
If the dash is a character inside text, use Find and Replace to replace “-” with nothing. If the dash is formatting, change the number format instead. If the dash appears as a placeholder for zero or blank, check the cell format or accounting format settings and adjust so zeros display as 0.How do I change number formatting in Excel (currency, percentages, dates) correctly?
Use Ctrl+1 to open Format Cells and set a consistent format for the column. For dates, confirm Excel recognizes them as dates by changing the format and seeing if the display updates. If nothing changes, the value is likely text and needs conversion before formatting will work. For large numbers, use commas consistently so totals are readable.How do I use conditional formatting to highlight trends or outliers?
Apply conditional formatting to only the data range, not whole columns. Use color scales for trends, icon sets for thresholds, or data bars for fast visual comparisons across data points. For custom rules, use formulas that test conditions based on your column headers and criteria.How do I create a dashboard in Excel that updates when data changes?
Build your dashboard from PivotTables, tables, or structured ranges so it expands automatically. Use slicers for filtering, and keep graphs and charts pointing to stable tables or PivotTable outputs. Make refresh steps obvious, like a note that says go to the Data tab and select Refresh All after importing new data.How do I build charts that stay readable when the dataset grows?
Base charts on Excel Tables so ranges expand. Limit clutter by charting fewer series, using clear labels, and avoiding tiny legends. If a chart becomes unreadable with more categories, switch to a PivotChart with slicers so viewers can filter to what matters.How do I fix Excel formulas when they return #N/A or #VALUE!?
#N/A usually means a lookup did not find a match, verify the lookup value and the lookup range. #VALUE! often means mixed types or invalid inputs, like text in a numeric calculation, or commas and separators that were imported inconsistently. Check for hidden spaces, text numbers, or mismatched formats and correct the underlying data for accurate results.What’s the easiest way to sum a column or range in Excel?
Use AutoSum (Alt+=) to sum a contiguous range quickly. For tables, use structured references so the range grows automatically. If you need conditional totals on sales data or other categories, use SUMIF or SUMIFS so totals change based on criteria.How do I count values based on a condition in Excel (like COUNTIF)?
Use COUNTIF for one condition and COUNTIFS for multiple conditions. Example: =COUNTIF(A:A,”Completed”) counts completed statuses. If you need multiple rules, COUNTIFS lets you stack criteria across columns for more precise counting.How do I write an IF formula that checks whether a cell contains partial text?
Use IF with a text search function. A common pattern is =IF(ISNUMBER(SEARCH(“text”,A2)),”Yes”,”No”). SEARCH is case-insensitive, and FIND is case-sensitive. Type it into a single cell, then press Enter, then fill down if needed.When should I use CHOOSE instead of nested IF statements in Excel?
Use CHOOSE when you have a single index that maps to a list of outcomes, like 1, 2, 3 selecting a label or rate. It keeps logic cleaner than stacking many IFs. If your logic depends on multiple conditions, nested IF or SWITCH can be a better fit.What does the NOT function do in Excel, and when should I use it?
NOT flips TRUE to FALSE and FALSE to TRUE. It is useful when you want to exclude a condition or invert a test inside IF, filtering logic, or validation rules. It can make certain rules easier to read than rewriting the condition from scratch.How do I build calculations that won’t break when I add new rows?
Convert your dataset to an Excel Table (Ctrl+T) and use structured references in formulas and graphs. Avoid hard-coded ranges like A2:A100. Tables expand automatically, so totals, charts, and PivotTable sources stay aligned as data grows.How do I create a PivotTable in Excel to summarize data fast?
Select a clean data range, ideally an Excel Table, then Insert, PivotTable. Drag fields into Rows, Columns, Values, and Filters to build the view. Start with a simple question, like totals by category, then add filters or grouping to refine.Why isn’t my PivotTable updating, and how do I refresh it properly?
Use the Data tab, Refresh All, or right-click the PivotTable and select Refresh. If new rows are missing, your source range may not include them. Convert the source to an Excel Table, then point the PivotTable to the table so the source expands automatically.How do I use Python in Excel, and what can it help me do compared to formulas?
Python in Excel can support more advanced analysis workflows inside the spreadsheet, like statistical work, data shaping, and model-like analysis that would be awkward in formulas. Availability and compute limits can vary by Microsoft 365 plan, so confirm access before you depend on it for a critical workflow.Excel Guides and Tutorials


Find a Specific Guide
Recent Guides