Target is heading into the holiday season with a red quarter and a lot to prove. Third-quarter profit fell 19 percent to $689 million as shoppers pulled back on discretionary purchases and focused on essentials, and the retailer now expects another low single-digit decline in comparable sales in the all-important fourth quarter.
In the three months ending November 1, Target’s profit dropped from $854 million a year earlier. It was the third straight quarter of comparable sales declines and the latest sign that the chain is still struggling to recover its once reliable “cheap but stylish” draw.
Those numbers look even tougher next to Walmart, which continues to grow by leaning into groceries and value pricing while Target gets squeezed between inflation-weary middle-income shoppers and lower-cost rivals. The company has already cut about 1,800 corporate roles and is rolling out more than 20,000 new items while cutting prices on staples, but so far those moves have not been enough to change the trend line.
Incoming CEO Michael Fiddelke, who takes over on February 1, is betting that a fresh merchandise mix and a heavy investment in stores can pull Target out of a multi-quarter slump. For anyone who lives in spreadsheets, that bet looks like a turnaround dashboard waiting to be built, with net profit, sales, traffic, capex, and layoffs all sitting in their own rows for the next several quarters.
Turning Target’s slump into a recovery dashboard
The cleanest way to follow this story is to lay out each quarter in a simple dashboard. Put the quarter and year in column A, then add columns for net profit, year-over-year profit change, total sales, comparable sales, and guidance.
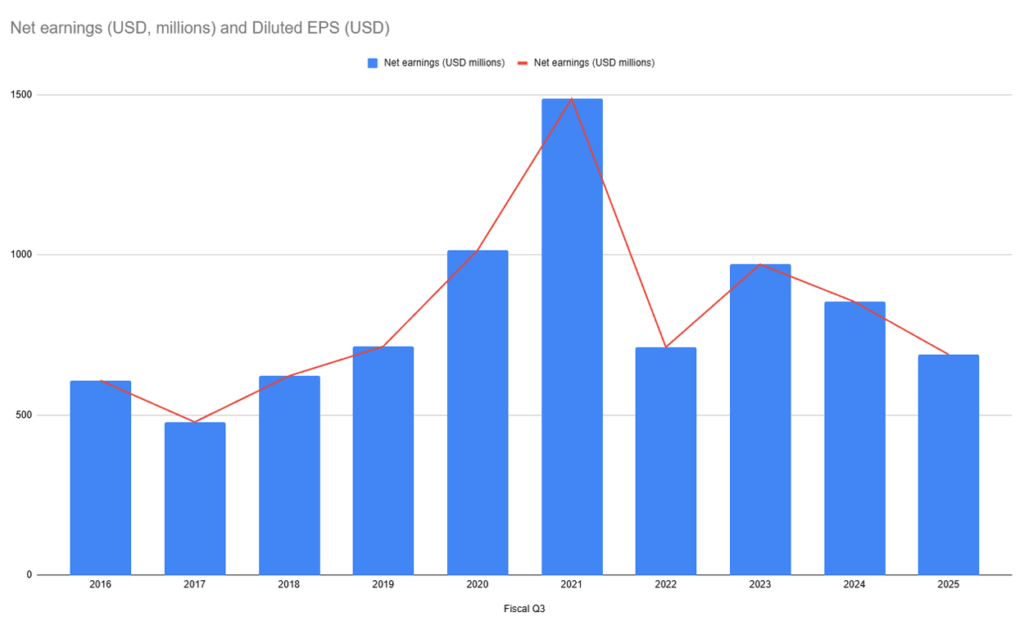
According to an Associated Press report carried by ABC News, Target’s third-quarter profit fell to $689 million from $854 million, sales slipped 1.5 percent to $25.27 billion, and comparable sales dropped 2.7 percent. Those numbers become the latest line in a sheet that already shows several quarters of weakness.
If you want to turn that grid into a real-time view of the business, you can rebuild it using a dedicated dashboard layout. A template like the Google Sheets dashboard guide walks through how to turn raw quarterly rows into charts and cards that highlight key metrics such as profit margin, comps, and traffic. Excel users who prefer Microsoft’s stack can follow a similar approach using the techniques in this Excel dashboard tutorial, then plug Target’s data into that framework.
Profitability deserves its own view. One tab can house a simple income statement style layout for Target, with revenue, cost of goods sold, operating expenses, and net income by quarter. Instead of designing that from scratch, you can adapt a ready-made layout like the Google Sheets profit and loss template or the step-by-step walk-through in this Excel profit and loss guide. Plug in the quarterly numbers the company reports and let the template calculate margins and year-over-year changes automatically.
Another tab can track the cost of Target’s turnaround. Management has already cut roughly 1,800 corporate jobs and plans to spend another $1 billion next year on remodels and new locations, bringing total store upgrade and expansion spending to about $5 billion.
You can log those commitments in a capital spending sheet, using categories for remodels, new stores, and technology, then watch that spending accumulate over time. The layouts in these investment tracking spreadsheets work well for following that kind of multi-year capex plan.
| Fiscal Q3 | Net earnings (USD, millions) | Diluted EPS (USD) |
| 2022 | 712 | 1.54 |
| 2023 | 971 | 2.10 |
| 2024 | 854 | 1.85 |
| 2025 | 689 | 1.51 |
Figures are GAAP net earnings and diluted earnings per share as reported in Target Corporation’s third-quarter earnings releases and Forms 10-Q for each year.
Once the structure is in place, simple formulas do most of the heavy lifting. A quarterly change column that uses functions like those in the SUMIFS tutorial for Google Sheets can pull together spending and revenue by category or time period. You can compare discretionary focused categories against essentials, or look at how price cuts and promotional campaigns line up with changes in comps and profit margin.
If you want to see how aggressive Target’s effort really is compared with peers, you can build a small comparison tab that logs similar metrics for Walmart and other retailers. A resource like this roundup of business-focused Excel templates can help you shape those comparisons into a cleaner scorecard, with separate sections for profitability, growth, and balance sheet strength.
The point of turning Target’s latest quarter into a recovery dashboard is not to obsess over one earnings release, but to watch how the pattern evolves. Over the next several quarters, you will be able to see whether Fiddelke’s mix of layoffs, price cuts, and store spending turns those red cells green or whether the retailer continues to bleed market share to Walmart and low-cost rivals.
We will be watching Black Friday sales this week to see whether the stores see an increase in media exposure, too. The intial data suggests a potentially weak holiday season.