Predict Trends with Linear Regression in Google Sheets (No Code Needed)

Here’s how to run both simple and multiple linear regression in Google Sheets using the built-in LINEST function. No add-ons or coding required.
Here’s how to run both simple and multiple linear regression in Google Sheets using the built-in LINEST function. No add-ons or coding required.

Only five champions held the sole first position after the 18th, 36th, and 54th holes. It first happened in 1941.

New data reveals a striking inverse relationship between NASDAQ Q1 growth and Detroit housing performance.
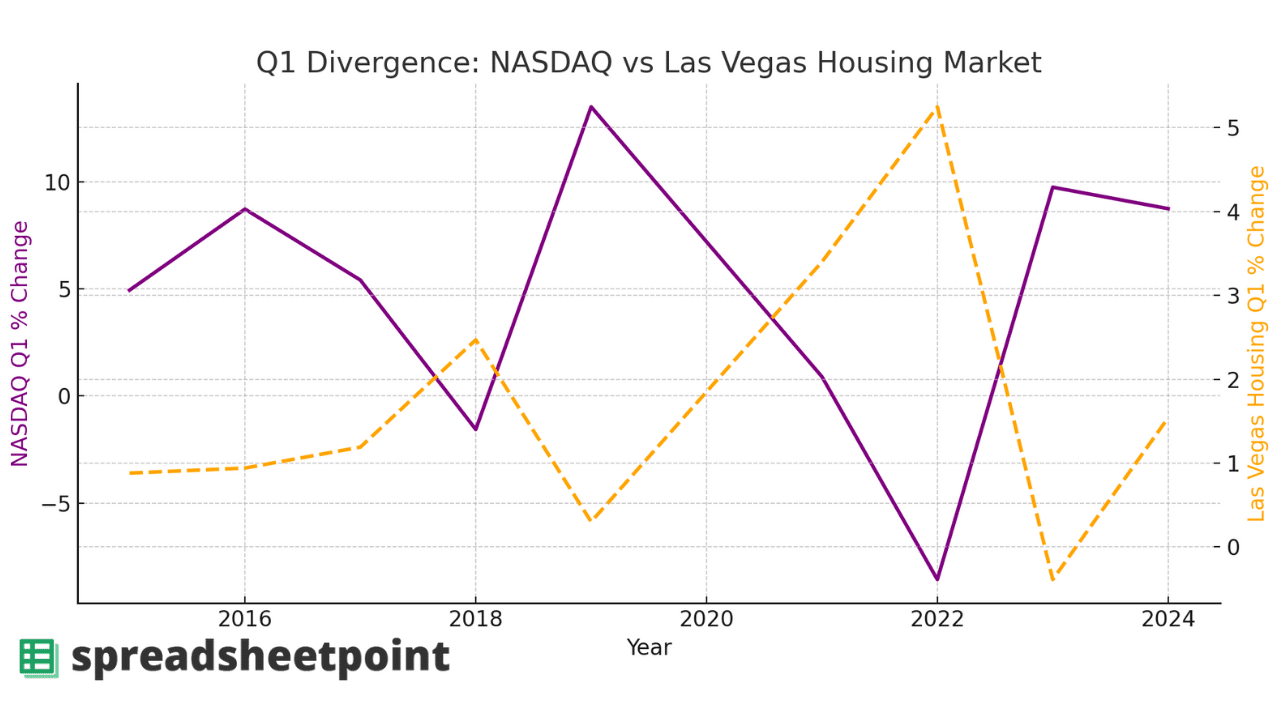
Las Vegas housing prices often dip or flatten when NASDAQ tech stocks are on the rise. New analysis reveals a striking inverse relationship.

The history of the papacy is filled with unusual, dramatic events. From a pope put on trial after death to a resignation that broke a 600-year tradition, the Vatican’s past is anything but predictable.
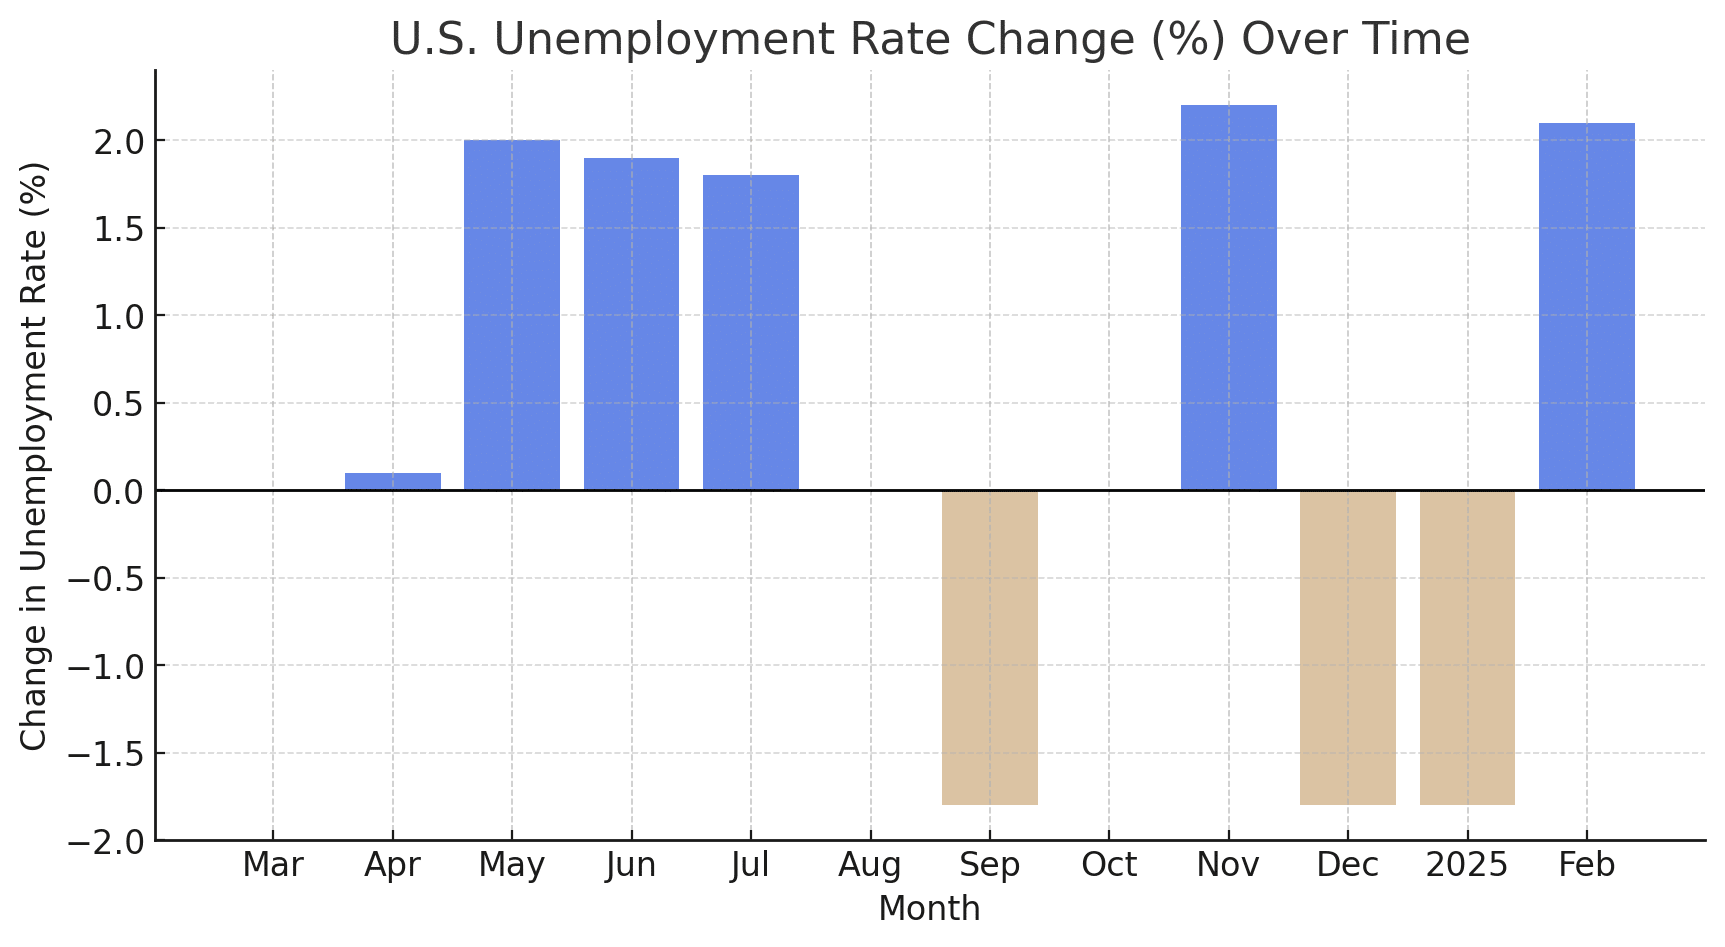
Are we in a recession? While the headlines may stir fear, the reality is more nuanced. Things look grim, and the data for Q1 will provide a more complete picture.

Excel is a cornerstone of data analysis, relied upon by businesses, researchers, and everyday users to make critical decisions. Yet, even seasoned professionals can misinterpret data due to common pitfalls, potentially leading to costly errors.

In the world of data management, small businesses often face a critical decision: should they use spreadsheets like Microsoft Excel or Google Sheets, or should they invest in a more complex database system? Here’s what to consider.

Need to flip your data in Google Sheets? This guide covers five methods for reversing column order, from the two-click Sort Range approach to the modern single-cell MAKEARRAY formula. Whether your data is sorted, random, or horizontal, there’s a method here that fits.