When dealing with data, we often need some metrics to understand the nature of the data. Some of these metrics include the average, the mean, mode, and standard deviation.
Google Sheets has some useful in-built formulas that you can use to perform a lot of statistical calculations, such as bell curves and standard deviation functions.
In this tutorial, I will show you how to find standard deviation in Google Sheets using a simple formula.
Table of Contents
How to Calculate Standard Deviation in Google Sheets
In order to calculate the standard deviation Google Sheets, we will use the STDEV function. This function uses only one argument, which can be a set of values, locations, or a combination of both. Simply type in the formula =STDEV() in a cell and select the range you want to use. This will give you the results.
A Helping Hand
If you’re having trouble with some of the more complex functions in Google Sheets. You should consider taking a comprehensive Google Sheets course to get off to a flying start.
What is Standard Deviation?
The standard Deviation of a dataset tells you how much the data deviates from the mean.
For example, suppose you have a class of 50 students and their scores in the Math exam. Now, if the mean score is 70 and the standard deviation is 10, it means that most of the student’s score is in +/- 10 range from the mean (i.e., most students has marks between 60 and 80).
While the mean gives a value that represents the entire data, the standard deviation tells how far the data is from this mean.
And what does this standard value can tell us about the data:
- A low standard deviation value tells us that most of the data points are closer to the average value of the dataset (the mean value)
- A high standard deviation value tells us that most of the data points are away from the mean (or there could be some outliers in the dataset)
The standard deviation is usually calculated by finding the square root of the variance.
This deviation (also called variance) is nothing but the average of the squared differences from the mean. It can be calculated using the formula:

- μ is the mean
- Σ means the ‘sum of’
- Xi is the value of each item in the list
- N is the number of items in the list
Find it complicated? Don’t bother!
I have just shown you the formula to let you know what it means. You don’t need this when trying to calculate the standard deviation on sheets.
There are in-built formulas in Google Sheets that will take care of everything.
In this article, we will look at how to calculate standard deviation in Google Sheets with examples. Let’s get started!
STDEV Formula in Google Sheets
Google Sheets has the STDEV function, which takes your dataset as the input and gives you the standard deviation value.
It really is this simple! You don’t need to know any formulas or be a statistics genius.
Below is the Syntax of the Standard Deviation formula in Google Sheets:
=STDEV(arguments)
Here, the arguments can be of four types:
- A set of values
- A range of locations
- A combination of values and location ranges
- A filtered set of values
Note that there need to be at least 2 values in the arguments for the formula to work.
Using the STDEV Formula in Google Sheets to Calculate Standard Deviation
Now let me show you some examples of calculating standard deviation in Google Sheets using the STDEV formula.
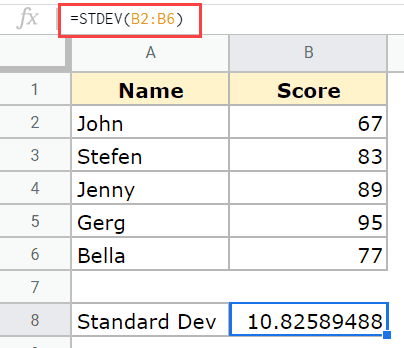
Suppose you have the following dataset and you want to get the standard deviation value of these scores.

You can use the below formula:
=STDEV(B2:B6)
Below is the result of this formula:

There are some more ways you use the STDEV Google Sheets formula.
You can manually enter the values in the formula, as shown below:
=STDEV(67,83,89,95,77)
This would be recommended only when you have a couple of values that can be entered manually. If you have a lot of values, it’s best to have these in Google Sheets cells and then use the range as the argument.
You can also use the individual cell reference instead of hard coding the values in the formula, as shown below:
=STDEV(B2,B3,B4,B5,B6)
This can be useful when you have the values in non-contiguous cells.
You can also combine a range and a cell reference (or value). For example, you can also use the below formula:
=STDEV(B2:B5,B6)
You can download a copy of our EXAMPLE SHEETS to follow along.
Calculating Standard Deviation with Multiple Datasets
Using the same sheets standard deviation formula to find the standard deviation when we have multiple columns of data.
Let’s look at our example below:

We can find the standard deviation for each subject. First, we need to find the standard dev for the Math column using the formula
=STDEV(B2:B6)

We can then copy the formula to the next two columns by dragging the small blue box at the bottom right corner of the cell to the cell in the fourth column.

This will give you the standard deviation for each column of data.
Calculating Standard Deviation with a Condition/Filter
Sometimes you may need to apply certain conditions to extract data points before calculating the Standard deviation.
In such cases, you can use the Filter formula inside your STDEV formula.
For example, if you want to calculate the standard deviation for only the students who scored above 70 (for some reason), you can type:
=STDEV(filter(location range, condition))
Here location range can be obtained by simply selecting the cells that you want to consider for the standard deviation. Condition is the criteria that qualify a cell value as eligible or not.
For example, the below formula will give you the standard deviation of only those scores that are above 70:
=STDEV(FILTER(B2:B6,B2:B6>70))
In the above formula, the FILTER function gives us only those values that are above 70. And then, the STDEV function takes these filtered values as the input and gives the standard deviation value for it.
Rules of Using STDEV
Below are some important points to keep in mind when using the STDEV function in Google Sheets:
- STDEV usually ignores any string parameter values (or cells that include text values). Of course, it goes without saying that if all your parameter values are strings, you are going to get an error.
- The STDEV formula calculates the standard deviation for a sample. If you need to find the standard deviation for a population instead, you will need to use the STDEVP formula.
- You need at least 2 number values in the arguments for the formula. Otherwise, you will get a #DIV/0! Error.
- Blank cells within your given range are ignored when calculating the Standard deviation using STDEV.
Other Standard Deviation Formula in Google Sheets
- STDEVP: This is used to calculate the Standard Deviation of a population
- STDEVA: This is used to calculate the Standard Deviation while interpreting text values as 0. This could be useful when you have dashes or some text, such as zero, in the cell and you want these to be counted as 0.
- STDEVPA: This is used to calculate the standard deviation of a population while interpreting text values as 0
STEDV.S Function
This is another Google Sheet standard deviation function that works the same as the STDEV function. It calculates the standard deviation of a single column or a range of cells.
The syntax for this function is:
=STDEV.S(array)
If we used the STEDV.S function in our example sheet, then we would get the same results as with the STDEV function.

The STDEV.S should not be used when the data points are less than 10 or when the data is not normally distributed.
Formatting the STDEV Result
The result of the STDEV formula is a number with a lot of decimals.
If you want to change this and make this number show up less number of decimals, you need to change the number formatting for it.
Below are the steps to do this:
- Select the cell that has the result
- Click the Format option in the menu
- Hover the cursor over the Number option
- Click on the Number option.

The above steps would change the number format so you only see two decimals in the result.
Wrapping Up
This article is a simple standard deviation Google Sheets guide. You can use the STDEV function with a single data set, multiple data sets, and filtered data sets.
I hope you found this Google Sheets tutorial useful. You can also check out how to add error bars in Google Sheets.
Related:


