If you are searching for a “game sales spreadsheet,” you probably want more than a pretty table. You want a working model that tells you where money comes from, what fees are doing to your margins, and how risky your storefront mix is if one platform changes the rules. This guide explains the spreadsheet we built for studios, how to use it, and why the formulas matter.
You can access the spreadsheet here.
What This Game Sales Spreadsheet Does
The workbook turns your title-level inputs into clear answers:
- How concentrated are my sales on Steam versus other stores
- What is my true take rate after fees and refunds
- What happens to net revenue if I shift a slice of units to a lower fee store
- Which titles carry single-point-of-failure risk
You can fill it in minutes and get a simple dashboard of flags and deltas that help you plan promotions and negotiate deals.
How to Make a Game Sales Spreadsheet
Open the Titles sheet and enter one row per game:
- Title, Launch Date, List Price, Units Sold, Refund Rate
- Storefront shares as percentages for Steam, Epic, GOG, itch, Direct, and Other
Edit the Fees sheet if your rates are different from the defaults. Then visit the Scenario sheet to set a simple test, such as moving 10 percent of sales from Steam to Epic.
Key terms you will see
Take rate. The percentage of gross revenue you pay to platforms. A 30 percent fee means you keep 70 cents on the dollar for that share of sales.
Net revenue. Gross sales after refunds and platform fees. This is the money that pays salaries and servers, so it deserves your attention.
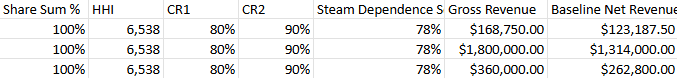
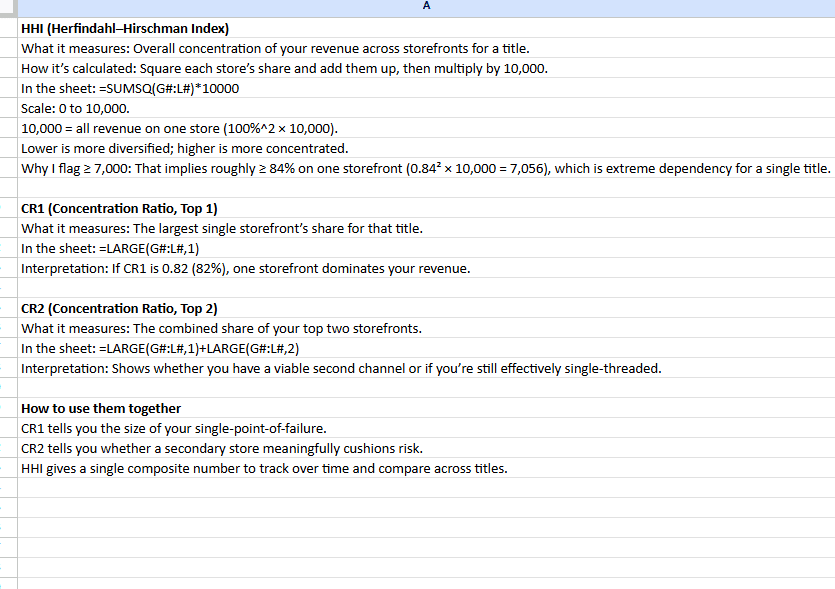
HHI (Herfindahl–Hirschman Index). A single number that measures concentration. It sums the squares of store shares and scales to a 0 to 10,000 range. A higher number means more concentration. If one store holds all sales, HHI is 10,000. If two stores are equal at 50 and 50, HHI is 5,000.
CR1 and CR2. The concentration ratios. CR1 is your largest store share. CR2 is the combined share of your top two stores. These help you see if you truly have a second channel or if most sales still sit in one place.
Steam Dependence Score. A quick screening index that blends Steam share, HHI, and a price parity flag. It highlights titles where a small policy change could have a large revenue impact.
The formulas, explained with plain English
Everything you see in the sheet is transparent and editable.
=D * C * (1 - E)
Units Sold × List Price × (1 minus Refund Rate). This removes refunds before platform fees are applied.
Baseline Net Revenue
For each store, multiply the revenue share by (1 minus fee), then add them together:
=Gross * [ Steam%*(1 - SteamFee)
         + Epic%*(1 - EpicFee)
         + GOG%*(1 - GOGFee)
         + itch%*(1 - itchFee)
         + Direct%*(1 - DirectFee)
         + Other%*(1 - OtherFee) ]
This gives your true after-fee inflow for the current mix.
Effective Take Rate (Baseline)
=IF(Gross=0, 0, 1 - Net/Gross)
This reports the blended platform cost across all stores. It moves up or down as your mix changes.
HHI
=SUMSQ(Steam%:Other%) * 10000
Squaring the shares amplifies big stores and rewards diversification. The 10,000 scale makes it easy to read.
CR1 and CR2
CR1 = LARGE(Steam%:Other%, 1)
CR2 = LARGE(Steam%:Other%, 1) + LARGE(Steam%:Other%, 2)
One glance tells you if a realistic fallback exists.
Scenario Net Revenue
The Scenario sheet defines three inputs: Shift From Store, Shift To Store, and Shift Percent. The model reduces the “from” share by that percent, increases the “to” share by the same amount, then recomputes Net Revenue with the same fee math shown above. The result shows whether a small reallocation improves your after-fee income.
Net Revenue Delta
=Scenario Net - Baseline Net
This is your dollar answer. If it is positive, the shift helped. If it is negative, the shift hurt. Use it to test 5, 10, and 20 percent moves before you commit to a promotion or bundle.
Why this approach works
- It focuses on net, not vanity numbers. Marketing teams love gross. Finance teams live on net. You should too.
- It quantifies concentration risk. HHI, CR1, and CR2 turn opinion into a metric you can track.
- It supports fast scenarios. Small shifts can show meaningful changes in your effective take rate and cash flow.
- It is store agnostic. You can add lines for regional stores, keys, or direct sales and the math still holds.
Practical tips
- Keep storefront shares current for the last 30, 60, and 90 days. Seasonality and promotions can hide risk.
- Track wishlist growth, follower counts, and external traffic in a separate tab. They explain why a shift may or may not work.
- Set flags for Steam share at or above 85 percent and HHI at or above 7,000. These titles need a mitigation plan.
Use this game sales spreadsheet to make clean, defensible decisions. Model before you move, and let the numbers guide your storefront strategy.