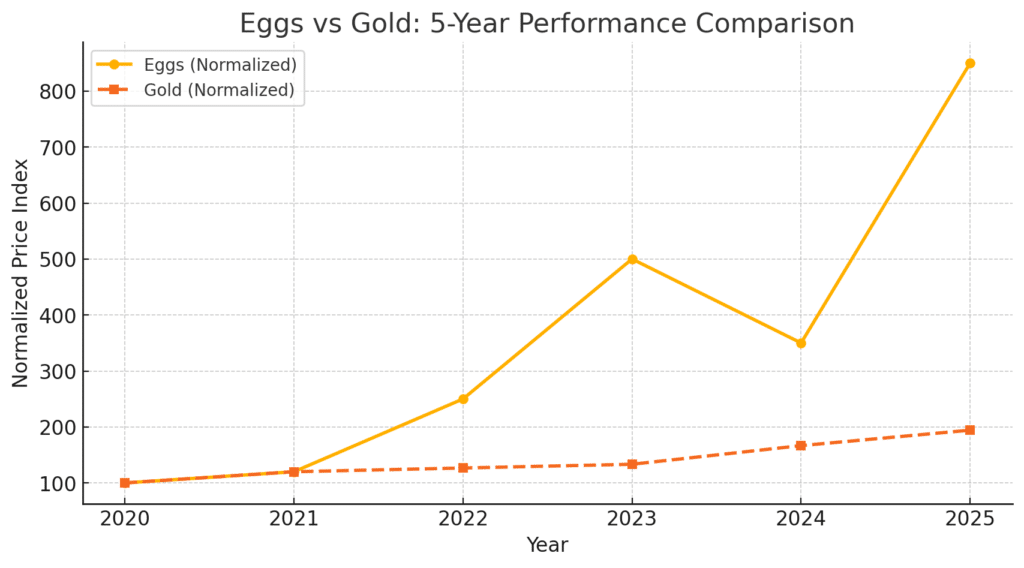
Gold has long been considered one of the safest investments. When markets get shaky, investors flock to gold as a hedge against inflation and economic uncertainty. But if the past five years have taught us anything, it’s that sometimes the best-performing assets are the ones no one expects. If you had invested in eggs instead of gold in 2020, your returns would have been nearly ten times higher.
It sounds ridiculous, but the data doesn’t lie. We checked. Between 2020 and 2025, egg prices skyrocketed by almost 800 percent, while gold prices only increased by about 70 percent in the same period.
Even when looking at a shorter window, from 2023 to early 2025, eggs saw a 600 percent gain, completely dwarfing gold’s 47 percent increase. It turns out, your breakfast staple wasn’t just essential for protein. It was also a major inflation indicator.

Let’s break it down. In May 2020, a dozen eggs sold for a dollar or two. Gold, on the other hand, was priced at $1,700 per ounce. Fast forward to March 2025, and eggs peaked around $8 per dozen before settling around $5 to $6 in recent months. Gold, meanwhile, climbed higher than $2,900 per ounce at its highest point.
This information was originally put together by a data scientist, Dr. Johns. He has a video with the in-depth analysis. But you don’t need to be a data scientist to evaluate trends. Want to tell your own story? Learn data analysis. It’s a valuable tool when working with any kind of information, and it’s marketable. But let’s get back to eggs.
At first glance, gold’s performance seems respectable. A 71 percent gain over five years is nothing to scoff at. But eggs were in a completely different league. If you’d been able to invest in eggs like you invest in gold (and somehow managed to sell them at their peak), your return would have been nearly 800 percent. Even at their recent dip, eggs still outperformed gold many times over.
For those wondering about shorter-term trends, eggs were still the better bet. In 2023, a dozen eggs could be purchased for about $2.50. By 2025, that price surged again over $5.50. That’s more than a 600% increase. Compare that to gold’s percent growth in the same timeframe, and there’s no contest. Eggs crushed gold as an investment.
The Story Behind The Surge in Egg Prices
Gold’s price tends to rise due to inflation, global instability, and market uncertainty. But eggs? Their unprecedented spike was the result of a perfect storm of avian flu outbreaks, supply chain disruptions, and economic instability. Bird flu devastated poultry farms, significantly reducing egg production. Combined with broader supply chain issues and rising feed costs, this created a massive supply shortage that sent prices soaring.
Unlike gold, which follows relatively steady macroeconomic trends, eggs became a speculative asset almost overnight. With shortages and panic buying, demand surged beyond what anyone expected. While prices have come down from their peak, they remain historically high, proving that even the most basic commodities can behave like volatile investments when conditions align.
The Lesson: Data Can Tell All Sorts of Interesting Stories
Here’s the truth: You couldn’t “invest in eggs” like you could invest in gold. And if you had invested in the surrounding industries the story wouldn’t be so rosy. The avian flu outbreaks and other challenges hit egg producers hard.
But there’s something interesting to consider when we see the price of eggs, the price you pay at the grocery store, when compared to the price of gold.
This is why data analysis is so important. It doesn’t just confirm what we already know; it reveals insights we might have completely overlooked. And you can make a combo chart in Google Sheets to tell the story.

Analyzing trends like the rise in egg prices requires the right tools. Google Sheets and Excel are great for quick calculations, data visualization, and simple trend analysis. Both allow users to track historical data, apply formulas, and create charts to see price movements over time. Just avoid common data analysis mistakes.
And you can dig deeper with a little more skill. Python and Pandas offer more robust insights. With Python, you can scrape data from multiple sources, clean and organize large datasets, and run statistical models to identify patterns. There are several Python projects that can help someone get started with this.
Pandas, a powerful data analysis library, makes it easy to manipulate and compare different variables, like inflation rates, supply chain disruptions, and commodity prices, to see what factors drive market changes.
Egg prices tell a fascinating story about inflation, supply shocks, and consumer demand, but they’re not the only commodity experiencing major shifts. Similar analyses could be done on coffee, beef, or lumber, all of which have seen price fluctuations due to global supply chain issues and climate-related disruptions.
Looking at housing prices vs. wage growth could reveal how affordability has changed over time. We could also track subscription service costs, like Netflix and Spotify, to see how inflation has affected digital services compared to physical goods.
Data is everywhere, and with the right tools, we can use it to tell compelling stories about how the economy affects everyday life.
Make your own charts, organize information, and analyze data with tips from Spreadsheet Point.


