Markets don’t wait for new presidents to settle in. They react immediately, and the response to Donald Trump’s second term has been one of the sharpest in recent history. In the first 50 days of his presidency, the S&P 500 dropped 7.32%, making it one of the worst early-market performances for a modern U.S. president. And that hasn’t improved on day 99. Since inauguration, the S&P 500 dropped by more than 8%.
This decline stands in stark contrast to Trump’s first term, when markets rallied on expectations of corporate tax cuts and deregulation. Now, doubts over competence, pain from self-inflicted trade policy decisions, and corporate earnings has driven a selloff.
How Markets Have Responded to New Presidents
Historically, market reactions to new administrations have been unpredictable. Some presidents have seen strong early gains, while others have faced immediate losses. A look at recent history highlights just how much these responses vary.
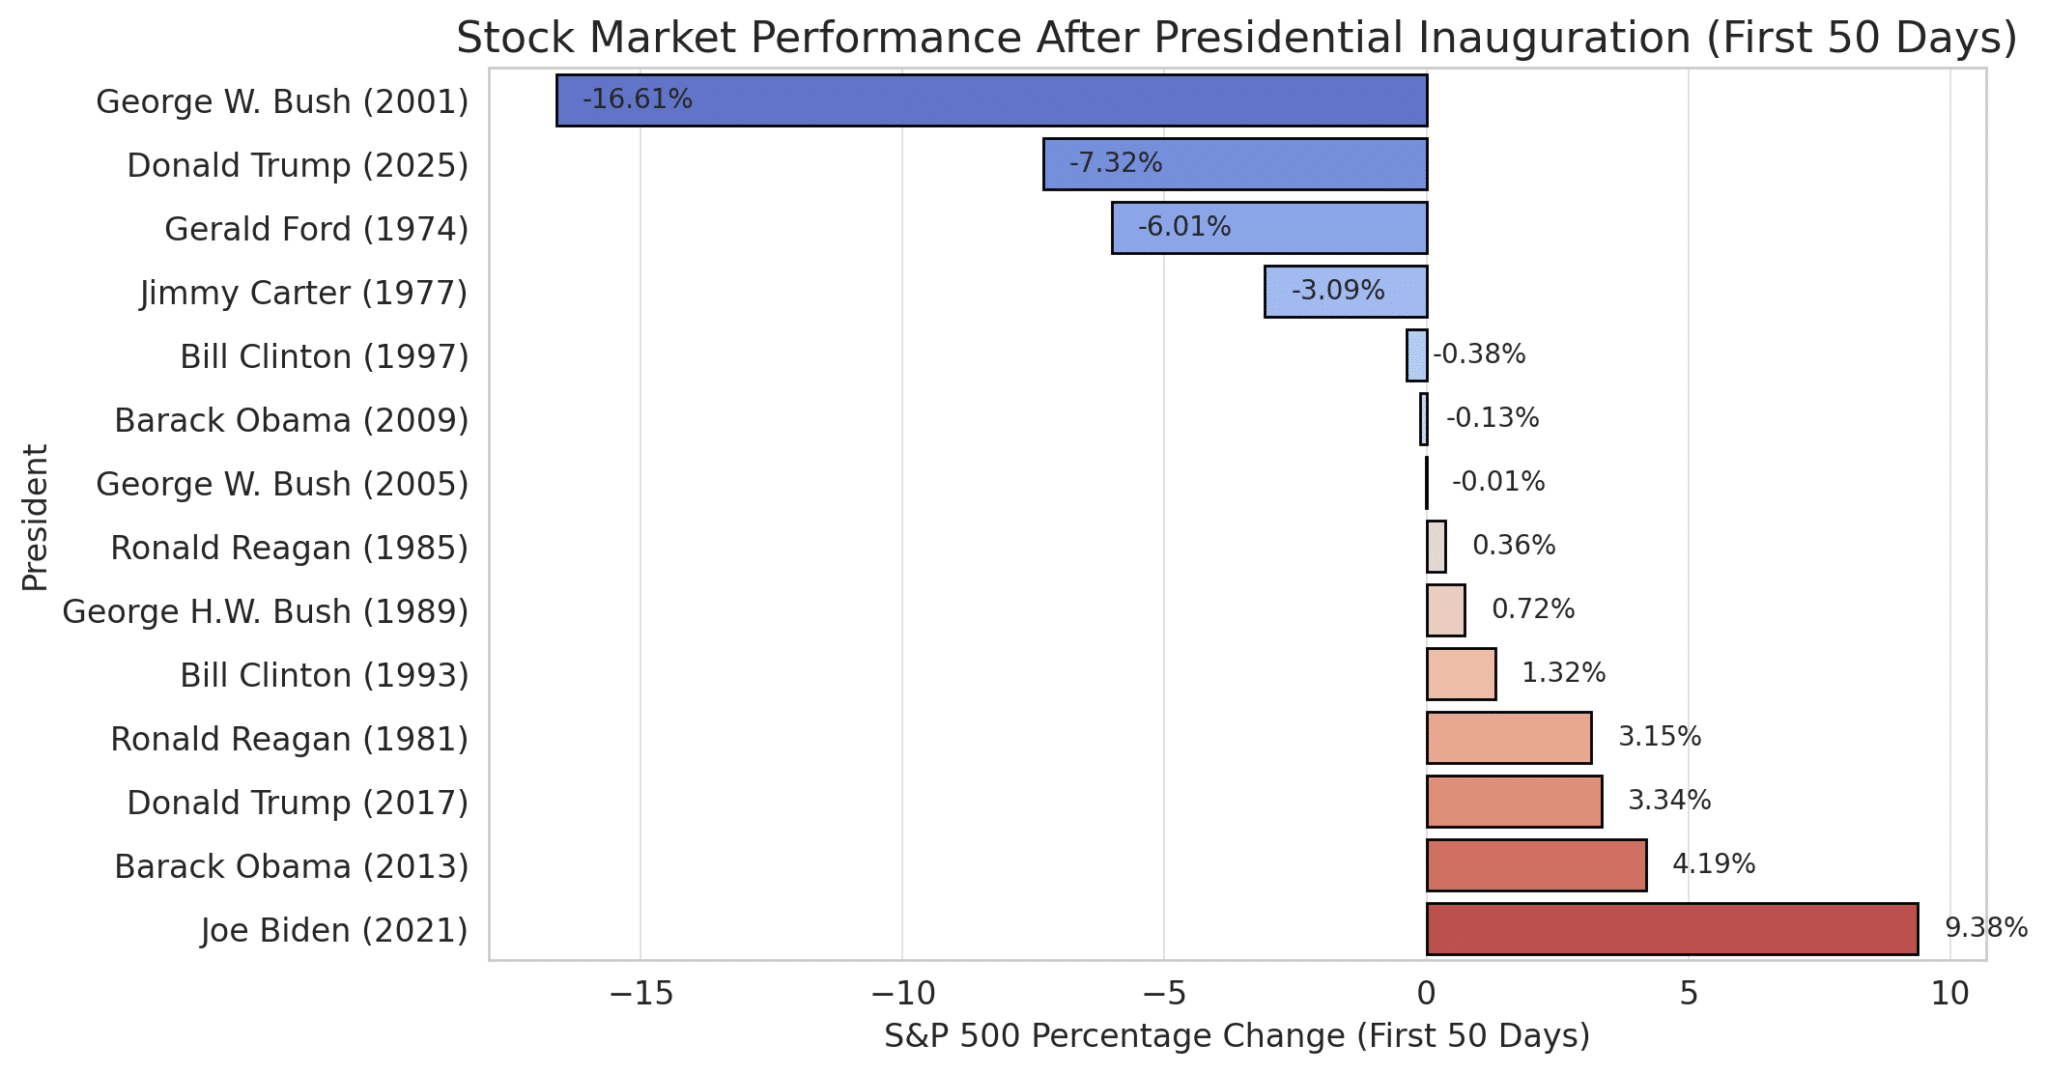
- Worst Post-Inauguration Drop: George W. Bush in 2001, with a 16.61% decline as the dot-com bubble collapsed.
- Best Post-Inauguration Gain: Joe Biden in 2021, with a 9.38% increase, fueled by pandemic recovery and stimulus spending.
- Trump’s First Term (2017): A 3.34% increase, driven by tax cuts and business-friendly policies.
- Trump’s Second Term (2025): A 7.32% decline, ranking among the worst early-market performances in modern history.
Even Gerald Ford’s 6% drop in 1974, which came during an energy crisis and economic turmoil, was less severe than what the markets are experiencing now.
Running this kind of market analysis in a spreadsheet, whether in Excel or Google Sheets, is surprisingly simple. By pulling in historical stock market data, inflation rates, or GDP figures, users can quickly visualize trends and compare how different presidencies have influenced the economy. Then we can visualize data.
The short version is pretty simple. If you want to analyze this year’s performance in a spreadsheet, it can look as simple as this:

That uses the GOOGLEFINANCE function to pull S&P 500 data from today (or yesterday’s close), the day of the election, and the day of the inauguration. Then it takes another quick formula to calculate the percent difference.
Combining that information with historic data makes it even more interesting. And it’s not hard to assemble. Basic functions like AVERAGE(), PERCENTCHANGE(), and TREND() allow for easy calculations of market performance over time, while charting tools help spot patterns that might not be obvious in raw data.
With integrations like Google Finance or external CSV imports, it’s even possible to set up a spreadsheet that updates in real time, providing a dynamic view of economic shifts. Note that there are several easy ways to make trend lines in Google Sheets.
However, the accuracy of any conclusion depends on clean, reliable data. Inconsistent formatting, missing values, or outliers can distort results and lead to misleading interpretations. Before running calculations, it’s crucial to filter out anomalies, remove duplicate entries, and standardize date formats to ensure that comparisons are valid.
Why the Market is Reacting Differently This Time
In 2017, Wall Street responded favorably to Trump’s first term, expecting tax cuts and deregulation. But in 2025, the outlook is different. Several factors are contributing to the selloff.
Tariff uncertainty is one of the biggest concerns. The administration’s shifting stance on new tariffs has left investors on edge, unsure of how trade policy will evolve. Markets thrive on predictability, and right now, there is none.
The broader stock market has taken a hit. The S&P 500 has fallen 8.7% from its all-time high, and the Nasdaq has dropped nearly 14%, with tech stocks facing the worst of the downturn. Companies that once led the market’s growth, Tesla, Nvidia, Alphabet (Google), and Meta (Facebook), are seeing their steepest declines since 2020. Tesla alone is down 15% in recent weeks.
Investment banks cut their growth forecasts. Goldman Sachs and other financial institutions have revised their outlooks downward, citing policy uncertainty and slowing corporate earnings. The administration’s efforts to reduce spending have further fueled concerns about economic momentum.
Recession fears grew, then solidified. Even President Trump has described the economy as being in a “period of transition,” while Treasury Secretary Besson has warned of a “detox period” as the government pulls back on spending. While these statements are meant to project long-term stability, they have done little to ease short-term investor concerns.
And they present a challenge to any leader holding public rallies supporting an authoritarian leadership brandishing tariffs over diplomacy.
What Comes Next?
Markets react quickly to new administrations, but policy decisions, not just politics, ultimately shape long-term trends. Right now, uncertainty over tariffs, government spending, and economic direction is driving volatility. History suggests that market downturns following presidential transitions aren’t solely tied to who is in office. The crashes under Bush in 2001 and Ford in 1974, for example, were the result of broader economic crises, not just political leadership.
The next GDP report will provide a clearer sense of where the economy is headed. Until then, two key questions remain unanswered: Is the U.S. heading into a recession, or is this simply a short-term correction before the market stabilizes?
Regardless of political views, the numbers paint a clear picture: the market’s reaction to Trump’s second term has been one of the worst in history. Some investors see an opportunity to buy stocks at a discount, while others are bracing for more volatility. And that buying window extended again and again since the start of the year.
What happens next will depend on policy decisions, global economic conditions, and investor confidence. For now, 2025 is shaping up to be one of the most unpredictable economic periods in recent memory. Investors, businesses, and consumers alike will be watching closely to see whether the early turmoil is temporary or the start of something much bigger.
Related Reading: 3 Ways People Misinterpret Excel Data, and How to Avoid Costly Mistakes