Google Sheets Tips
How To Sort in Google Sheets [2 Easy Methods]
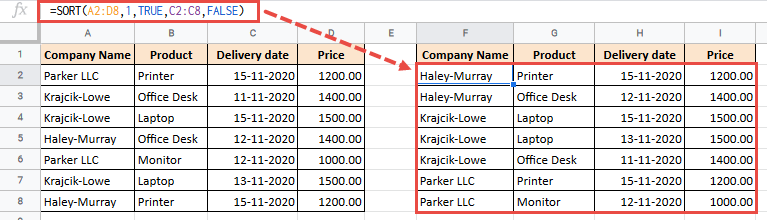
It’s always easier to work with data that has been organized and sorted in a particular order. This is why the Sort function in Google Sheets is so useful. But

It’s always easier to work with data that has been organized and sorted in a particular order. This is why the Sort function in Google Sheets is so useful. But

Google Sheets is known for having a number of convenient and time-saving features. One such feature is the option to find and replace text. Finding and replacing text within a

If you want to find the sum of values based on a condition, you most probably are aware of the SUMIF formula and the SUMIFS Google Sheets function. The problem

Visualizing data using charts and graphs can be a great way to understand your data and relationships between the variables in the data. Moreover, adding a trend line (also called

Calculating the average is a common task for people working with data in Google Sheets. And when quantities in a dataset don’t carry the same amount of importance, finding simple

Google Sheets provides a suite of functions called the “IS” functions. These functions are not commonly used purely on their own but are heavily used by Google Sheets experts in
A sequence of numbers is said to be statistically random when it does not contain any recognizable patterns. In statistics, randomness can be quite crucial. For example, one often needs
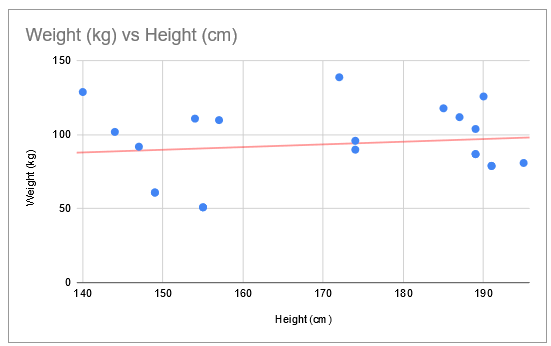
How to Make a Scatter Plot in Google Sheets – Video tutorial: Visualization tools like charts and graphs are beneficial for giving better insights into your data. A scatter plot

Let’s talk about how to use VLOOKUP with multiple criteria. After all, I often use this formula to find data based on more than one thing. Fortunately, there’s an easy