
Google Sheets Tips
Google Sheets Count Cells with Text | Full Guide
To count cells with text, you’ll need to use a specific function. This can be done with either COUNTA or COUNTIF. However, note that the COUNTIF function only counts cells

To count cells with text, you’ll need to use a specific function. This can be done with either COUNTA or COUNTIF. However, note that the COUNTIF function only counts cells

To split cells in Google Sheets, highlight the cell, select the “data” menu, and click “split text to columns”. Otherwise, use the SPLIT function. I’ll demo both in my guide

There’s a simple way to spell check in Google Sheets. Below, I’ll show you where to find it and how to make the most of it. Note that this differs
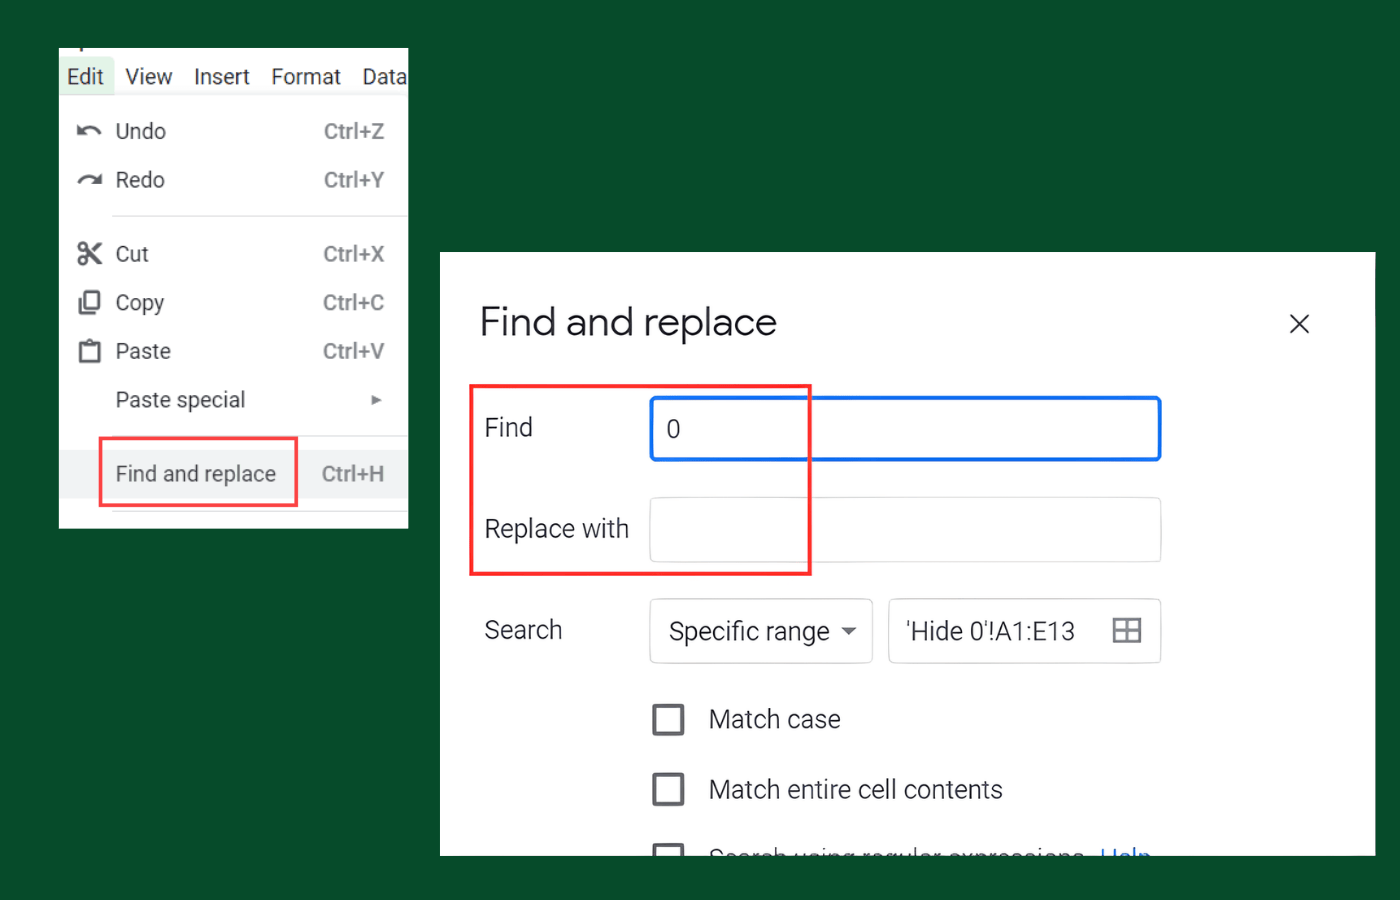
Do you need to hide zero values in Google Sheets? You’re in the right place. Sometimes, your data set looks cluttered with a bunch of zero values. That might be

Google Sheets VLOOKUP from another sheet is a simple way to pull data from other sources. To VLOOKUP from another sheet in Google Sheets, you can use the IMPORTRANGE function

Want to learn how to delete empty rows in Google Sheets? It’s a valuable skill that I use regularly, and luckily, it’s easy to learn, especially as I have highlighted

Occasionally, you may need to keep track of work by using a timestamp. This simple record is a great way to illustrate precisely when activities were carried out. It’s also
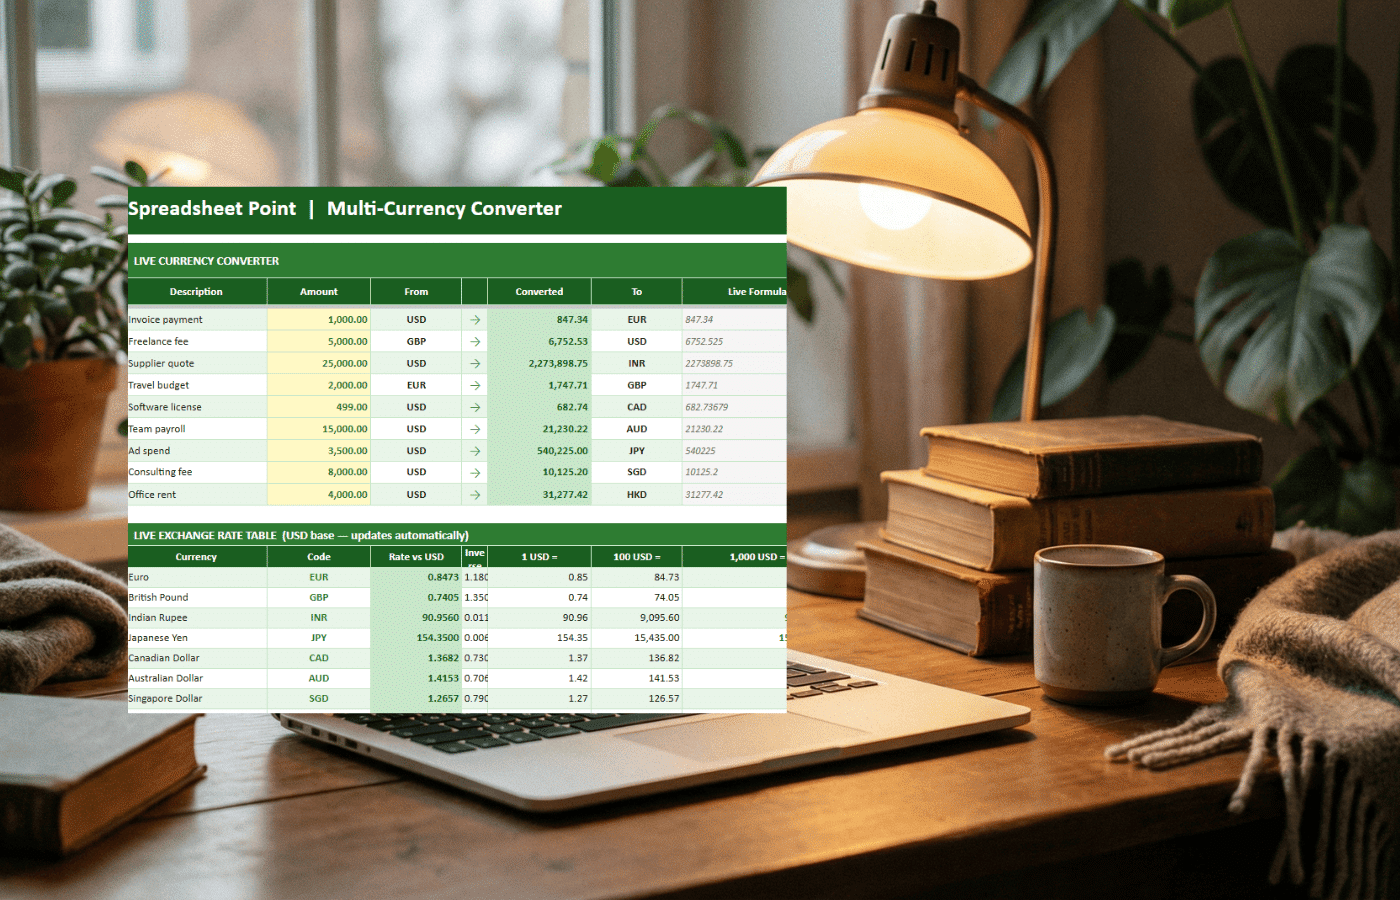
Google Sheets can convert currencies automatically with one GOOGLEFINANCE formula. This guide shows how to pull live exchange rates, convert amounts from USD to popular currencies, fetch historical rates, troubleshoot errors, and handle Excel currency conversion when you need it.
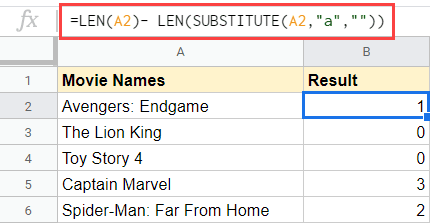
If you work with text data in Google Sheets, you may occasionally need to know the character count in Google Sheets. It turns out that it’s extremely easy to use