For all the noise around politics, there’s a rare point of agreement. People across the spectrum think everyday life has become painfully expensive.
A new poll has put numbers to something a lot of people already feel in their bank accounts. According to a Politico survey run by Public First, 37 percent of Trump supporters and 53 percent of Harris voters say affordability has never been worse in their lifetimes.
The poll highlights how broad the anxiety has become. This is not just about the price of eggs or a single bad rent increase. Respondents pointed to housing, groceries, utilities, insurance, and basic services all moving higher at the same time. The feeling that “everything went up at once” is now a common refrain, and the numbers in this survey back that up.
What makes the data politically sensitive is where voters aim their frustration. Roughly one in four Trump voters in the sample said he bears some responsibility for higher prices. At the same time, the White House has argued that the administration inherited an economic mess and is already turning the ship around, pointing to slower headline inflation and jobs data as proof that the worst is behind us.
That argument is not landing with everyone. During a recent Cabinet meeting, the president reportedly dismissed concern about rising costs as a political con job and even questioned whether the word affordability has any real meaning.
To people counting every dollar, that feels detached from reality. When rent, car insurance, and the weekly grocery run all cost more, the debate over labels is not very interesting. The math is what matters.
That is exactly where this community tends to live: in the math. If you spend your day thinking in rows and columns, a poll like this is an invitation to start building your own affordability dashboard instead of just arguing about vibes. Rather than asking whether life merely feels more expensive, you can quantify it month by month in a spreadsheet and compare your own numbers to what the poll suggests.
At the household level, the simplest move is to track cash going out the door. A basic monthly expense log with categories for housing, utilities, groceries, transport, debt payments, subscriptions, and childcare already gives you more insight than most people have. If you do not want to start from a blank sheet, you can plug your numbers into an existing Google Sheets expense tracker template and have charts and summaries ready to go with very little setup.
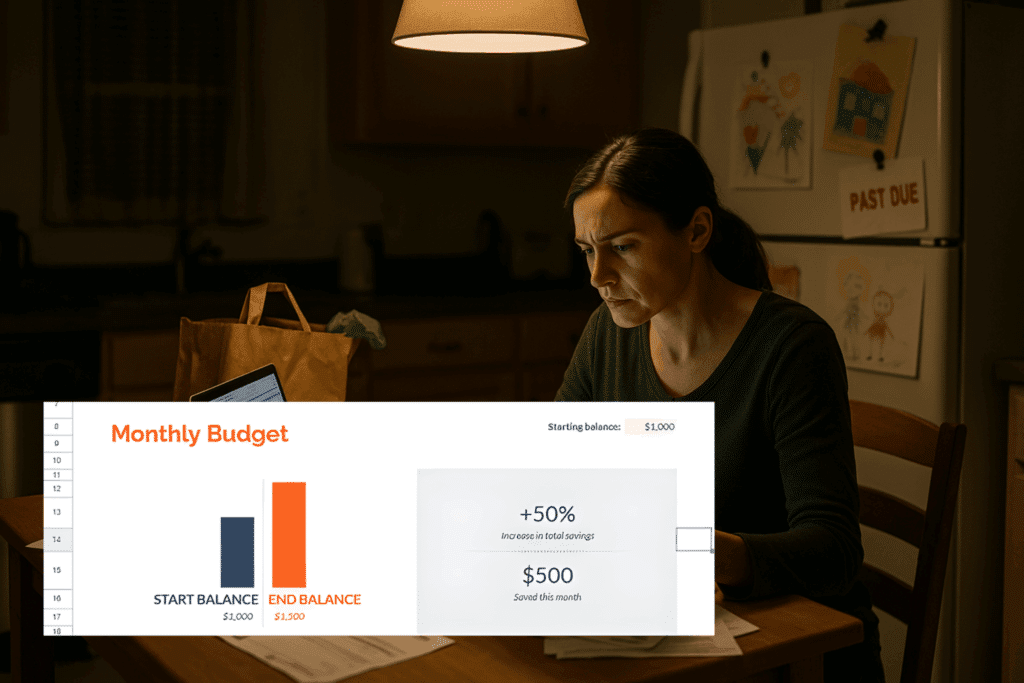
Once you see where the money really goes, you can layer on a simple budget. For a lot of readers, this is where the shock shows up. You realize how much of your take-home pay is locked into rent or a mortgage and how thin the margin is for everything else.
A structured budget template in Google Sheets makes it easier to test scenarios, like what happens if rent increases five percent next year or if you finally cancel a recurring subscription that you forgot about months ago.
People who are thinking long term can take this a step further by tracking their balance sheet, not just their bills. A poll about affordability focuses on feelings in the moment, but a good net worth spreadsheet tracks how assets and debts shift over years. It gives you a different view of whether your financial life is actually getting worse or whether short-term pain might be masking slow progress on paying down loans or growing retirement accounts.
The poll that kicked off this conversation is politically charged, but the underlying story is simple. A large share of voters in both parties feel squeezed by rising costs and do not think Washington is taking it seriously enough.
You cannot control what the next administration does about inflation, but you can control how well you understand your own situation. Turning anxiety into a clean sheet of data is not a cure for high prices, yet it is a first step toward making rational decisions in a messy economy.
In the months ahead, expect more surveys (like the one from Politico) that slice and dice this affordability story by party, age, and income. Here, the most useful questions will be practical ones: Are your numbers getting better or worse, and how quickly would you know if they changed? That is the value of treating affordability as a data problem instead of just a talking point.