President Trump says Republicans are drafting legislation to sanction any country trading with Russia, marking a shift after months of stalled peace talks, and a spreadsheet shows which countries will be most affected by potential changes.
President Donald Trump announced on Sunday that Republican lawmakers are preparing legislation to impose sanctions on any nation conducting business with Russia. Speaking to reporters, Trump said the measure would be “very tough” and could extend to Iran as well.
The proposed sanctions would have sweeping consequences. Major U.S. allies including Japan, South Korea, and Singapore purchase Russian energy, while China dominates trade in Russian coal and crude oil. The European Union remains a significant buyer of Russian liquefied natural gas.
And we always try to look at the numbers behind the story. In this case, it’s the economic impact for specific trading partners. Who trades with Russia, and how much, is a good starting point.
Beyond energy, numerous countries sell Russia agricultural goods or purchase Russian weapons, creating a complex web of economic entanglement that broad sanctions would inevitably disrupt. This comes at a time when the secretary of defense announced operations in Central America, another move with international consequences (and more than a few interesting data points to analyze).
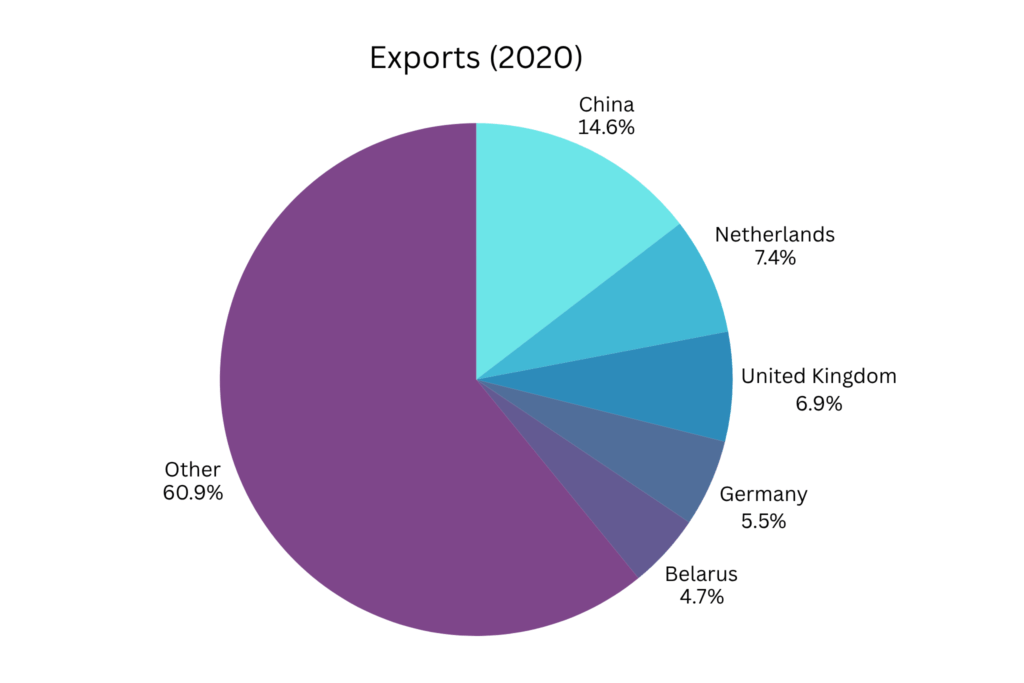
To get a sense for where Russia sends goods, we evaluated the numbers for a few years. These are estimated numbers for 2020:
| Rank | Partner | Exports (US$B) | Share of Russia’s exports |
|---|---|---|---|
| 1 | China | 49.1 | 14.6% |
| 2 | Netherlands | 24.8 | 7.4% |
| 3 | United Kingdom | 23.2 | 6.9% |
| 4 | Germany | 18.6 | 5.5% |
| 5 | Belarus | 16.0 | 4.7% |
The spreadsheet itself is simple by design. We pulled Russia’s export data from public trade statistics and focused on two snapshots, 2020 as a pre-war baseline and the most recent figures (which come from 2024).
For each year, we looked at Russia’s total exports by destination, then ranked trading partners by the dollar value of goods they receive. You can pull numbers from a variety of sources, like the World Integrated Trade Solution. That gives us a clean, comparable list of who buys what from Russia over time, without getting lost in dozens of product codes or customs categories.
Below are the most recent full-year estimates. Note the increase from Turkey and Belarus. Just note a few caveats. Some of the recent figures are estimates based on mirror trade data rather than Russian disclosures, and the table only shows the top five partners in each year, not the entire global picture.
Even so, it captures the broad story. If a country appears near the top of Russia’s export list, it is deeply tied into Russian supply, and any sweeping sanctions on “countries trading with Russia” would land on that relationship first.
| Rank | Partner | Exports (US$B) | Share |
|---|---|---|---|
| 1 | China | About 68.9 | 14.0% |
| 2 | Netherlands | About 42.3 | 8.6% |
| 3 | Germany | About 29.5 | 6.0% |
| 4 | Turkey | About 26.6 | 5.4% |
| 5 | Belarus | About 23.1 | 4.7% |
Put side by side, the 2020 and 2024 rankings tell a story that is hard to miss. China was already Russia’s top customer before the full-scale invasion of Ukraine, and it remains in that position.
The more important shift is in the rest of the list. In 2020, European partners like the Netherlands, the United Kingdom, and Germany were central nodes in Russia’s export network. By 2024, Turkey and Belarus have pushed onto the list, reflecting a broader pivot toward “friendly” or neutral states that are willing to keep buying Russian energy and commodities.
That shift matters for any Trump-backed sanctions bill. A decade ago, a threat to target “any country trading with Russia” would have been aimed squarely at European capitals. The current numbers suggest a different reality.
Today, the heaviest pressure would fall on Beijing, Ankara, and Minsk, along with a set of regional intermediaries that sit just outside the core U.S. alliance system. That essentially maps where Washington would have to be willing to pick fights if it wants secondary sanctions to mean anything.
Meanwhile, international responses have been mixed. Russian officials characterized the sanctions threat as evidence that the U.S. remains hostile despite Trump’s peace rhetoric. Chinese officials have countered that dialogue and negotiation, rather than coercion, offer the only viable path to resolving the Ukraine crisis. Trump provided no timeline for when the sanctions legislation might advance through Congress, which has reconvened since the longest-ever government shutdown.
At the rhetorical level, Trump’s threat to sanction any country trading with Russia fits a familiar pattern. It is blunt, it is maximalist, and it sidesteps the slow work of multilateral diplomacy that has stalled in Ukraine. At the numerical level, the picture is less sweeping than the soundbite suggests.
Russia’s export map has already shifted away from many U.S. allies and toward a smaller group of “friendly” buyers who have proven willing to absorb discounted oil, gas, and other commodities. One could use more in-depth historical trade details to help predict additional impacts. Even a simple Google Sheets dashboard could help quickly show changes from one year to another.
That is where any spreadsheet earns its keep. It strips away the slogans and shows which countries actually sit at the center of Russia’s trade network in the latest data. Any serious attempt to follow through on Trump’s proposal would force Washington to decide whether it is willing to confront those partners directly, or whether this is another case where the threat is louder than the legislation that follows.
And when it comes to which countries pay most for sanctions on Russia, the answer depends on how seriously the sanctions are enforced. China is the top customer, and that is unlikely to change anytime soon.