Most marketing reports get built the same way. You pull numbers from five different platforms, paste them into a spreadsheet, do the math manually, and spend 45 minutes formatting before the meeting. Then you do it again next month.
This free marketing metrics dashboard template for Google Sheets cuts that process down to data entry. Enter your channel numbers once. The dashboard calculates spend totals, CPL, ROAS, MoM changes, and budget variances automatically. The summary view is ready to share the moment you finish entering data.
Click here to get a free copy of the template.
What this marketing metrics dashboard tracks
The template covers seven channels out of the box: SEO, Paid Search, Paid Social, Email, Organic Social, Content, and Direct. For each channel, it tracks spend, impressions, clicks, leads, and revenue. From those inputs, it calculates CTR, CPL, CPC, ROAS, and lead conversion rate automatically.
At the dashboard level, it surfaces six top-line numbers: total spend, total impressions, total clicks, total leads, blended CPL, and average conversion rate. Below that, a channel performance table shows every channel side by side. A budget vs. actual section tracks whether each channel is on budget, near its limit, or over. A goals table lets you set monthly targets and see progress against them in real time.
There is also a monthly trend tab that tracks key metrics across up to 12 months, pre-loaded with six months of sample data to show you what the history view looks like once it fills in.
Benefits of the spreadsheet over marketing dashboard software
Marketing dashboard software gives at-a-glance overviews of marketing efforts across mediums (including social media channels and in some cases even various client accounts). But software gets expensive. So we made this marketing dashboard spreadsheet instead. And we’re sharing it here for free.
The file has four tabs: Marketing Dashboard, Channel Data, Monthly Trend, and Instructions. You can use it to track various performance metrics, and it’s easy to adapt for various types of business. The main benefit: completely customizable dashboards, easy-to-duplicate and share with clients, and free (forever) with no add-ons or other extra costs.
Marketing Dashboard tab
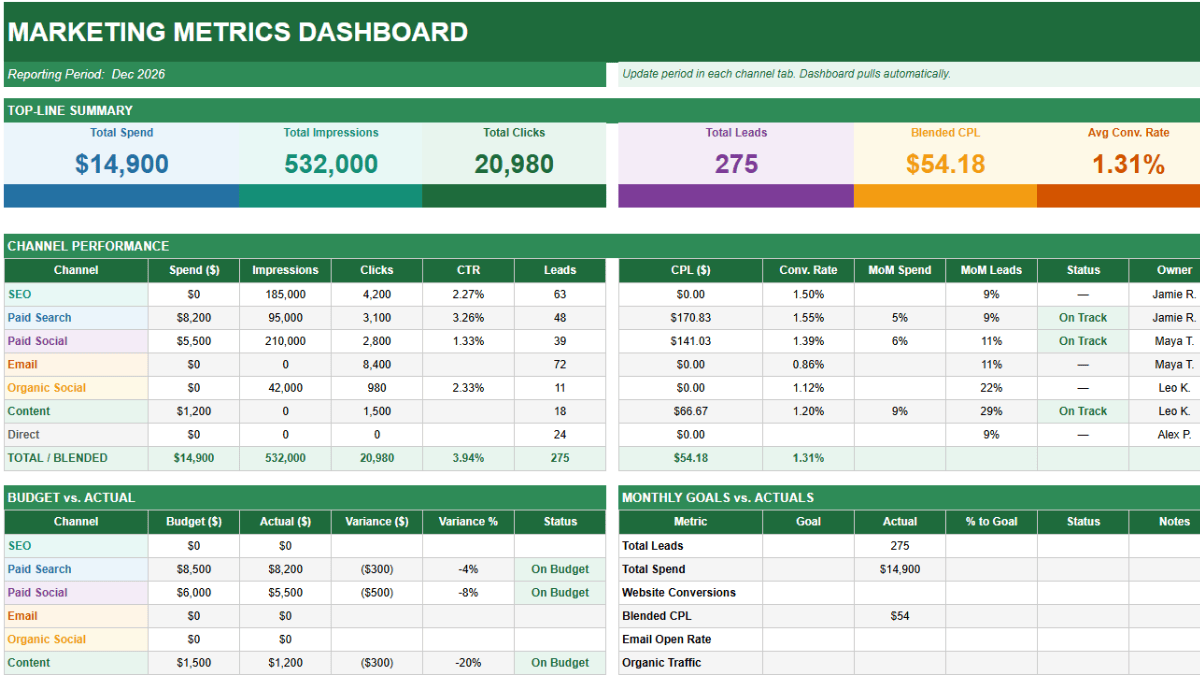
This is the report view. It pulls everything from the Channel Data tab automatically and organizes it into four sections.
At the top, a scorecard row shows your six top-line metrics for the period. Below that, the channel performance table lists every channel with spend, impressions, clicks, CTR, leads, CPL, conversion rate, and month-over-month changes for both spend and leads. A status column shows whether each channel is on track or off track against its budget. The budget vs. actual table on the left shows the full spend picture by channel. The goals table on the right lets you track up to seven monthly targets with automatic status updates.
Nothing on this tab needs to be updated manually. It all calculates from Channel Data.
Channel Data tab
This is where you enter numbers. The tab has three sections.
The current period section is the main data entry area. For each channel, enter spend, impressions, clicks, leads, revenue, and budget. Channels with no direct spend (SEO, Email, Organic Social, Direct) have those fields set to zero by default. You still enter clicks and leads for those channels, which is where the value is.
The previous period section is a separate block below the main table. Enter last month’s spend and leads for each channel. Those numbers feed the MoM percentage change columns automatically.
The computed metrics section calculates CTR, CPL, CPC, ROAS, and lead conversion rate for every channel. These cells are formula-driven. Nothing to enter, nothing to maintain.
Monthly Trend tab
A rolling history table with columns for each month. The tab comes pre-loaded with six months of sample data (October 2025 through March 2026) so you can see what a mature dashboard looks like. At the end of each period, copy your current numbers into the next available column. Over time this builds the trend view that makes month-over-month and quarter-over-quarter comparisons easy.
The tab tracks total spend, total leads, total revenue, blended CPL, and average conversion rate at the top. Below that, a channel-level spend breakdown shows where the budget went each month.
Instructions tab
A plain-language setup guide covering the five-step workflow, what each tab does, metric definitions, status thresholds, and tips for adding channels or customizing the goals table.
How to use the marketing metrics dashboard
Step 1: Enter current period data
Go to the Channel Data tab. In rows 5 through 11, enter your numbers for each channel: spend, impressions, clicks, leads, revenue, and budget. Blue cells are manual inputs. Everything else calculates.
For channels with no paid spend, enter zero in the Spend and Budget columns. Still enter clicks and leads. Those are what drive the conversion rate and CPL calculations.
Step 2: Update previous period data
Scroll down to the Previous Period Data section in Channel Data. Enter last month’s spend and leads for each channel. These are the only numbers needed for MoM calculations. You do not need to store the full previous month’s marketing data anywhere else.
Step 3: Set your monthly goals
Switch to the Marketing Dashboard tab. On the right side, find the Monthly Goals vs. Actuals table. The Goal column is blank by default. These are your targets to fill in. Total Leads and Total Spend pull from Channel Data automatically. Other rows like Website Conversions, Email Open Rate, and Paid ROAS are set up for manual entry.
Step 4: Review the dashboard
Everything else is done. The scorecard at the top shows your period totals. The channel table shows every channel’s performance data side by side. Budget vs. actual shows where you stand on spend. The goals table shows whether you are on track for the month.
Step 5: Log the month in Monthly Trend
At the end of each period, copy your key metrics into the next available column in the Monthly Trend tab. This takes about two minutes and builds the historical view over time.
Key metrics the template calculates
Six metrics drive most of the useful insights in marketing performance reporting. Here is what each one actually measures.
CTR (click-through rate) is clicks divided by impressions. For paid channels it tells you how well your ads are capturing attention. For SEO it reflects how compelling your title tags and meta descriptions are relative to what users are searching for.
CPL (cost per lead) is spend divided by leads. It is the most direct measure of channel efficiency for lead generation. A Paid Search CPL of $90 next to an Email CPL near zero tells you something about where your next dollar should go.
CPC (cost per click) is spend divided by clicks. Useful for paid channels as a quality signal. Rising CPC with flat or declining conversion rate means you are paying more for the same results. If you run Google Ads, this is the number that tells you whether your bidding strategy is holding up.
ROAS (return on ad spend) is revenue divided by spend. A ROAS of 3.0 means you generated three dollars in revenue for every dollar spent. It is one of the cleaner measures of roi available for paid channels. The threshold for a healthy ROAS varies by industry and margin structure, but anything below 1.0 means you are spending more than you are making back.
Lead conversion rate is leads divided by clicks. It measures how well your landing pages and offers convert the traffic each channel sends. Two channels with the same CPL but different conversion rates have very different economics once you factor in what it costs to drive each click.
MoM change is the month-over-month percentage change in spend or leads versus the previous period. It is the fastest way to spot channels that are accelerating or declining without needing to look at the full trend tab.
How to use the budget vs. actual section
The budget vs. actual table compares your planned spend against what you actually spent for each channel. Variance is shown in dollars and as a percentage. Status is calculated automatically: On Budget means actual spend is at or below the budget figure, Near Limit means spend is between 100% and 110% of budget, and Over Budget means spend has exceeded 110%.
The total row at the bottom shows blended budget adherence across all channels. If individual channels are over budget but the total is on track, that signals a budget reallocation rather than an overspend problem.
For channels with no direct spend (SEO, Email, Organic Social, Direct), set the budget to zero and the status column will show a dash rather than a budget status. Those channels are tracked on efficiency metrics instead.
How the MoM calculations work
Month-over-month changes in the template come from the Previous Period Data section in the Channel Data tab, not from the Monthly Trend tab. The two are separate by design. It keeps the current period data entry clean, and you only need to enter two numbers per channel to get MoM context.
At the start of each new month, copy last month’s spend and leads into the Previous Period section. Enter the new month’s data in the current period rows. The MoM columns update immediately.
For a longer view of trends over six or more months, the Monthly Trend tab is where to look. That data is entered manually at the end of each period and builds over time.
Which channels to include
The template comes with seven channels that cover most small business and agency marketing programs. Not every channel will be active in every period. Channels with no activity should have all fields set to zero rather than left blank. This keeps the totals accurate and avoids formula gaps.
If you run additional channels not in the template, you can insert a row between rows 5 and 11 in Channel Data. Copy the formatting and formulas from an adjacent row. Then extend the SUM ranges in row 12 and the totals row on the dashboard to include the new row. The Instructions tab has a step-by-step note on this.
If you want to track content engagement alongside your paid and organic channels, a social media calendar template pairs well with this dashboard. Use the calendar for planning and scheduling, and log the resulting traffic and lead numbers here.
Google Sheets vs. dedicated marketing dashboard software
Tableau, Power BI, and Google Looker Studio all connect directly to analytics platforms and pull marketing data automatically. Google Looker Studio connects natively to Google Analytics and Google Ads, which means real-time visualization of performance data without any manual entry. For a marketing team managing ten or more additional data sources across multiple analytics platforms, that automation is worth something.
The cost structure is worth understanding before you go that route. Most marketing dashboard software prices by seat or by feature tier. Unlimited users is rarely the default. White-label dashboards, the version marketing agencies need for client reporting, are almost always a premium add-on. Predictive analytics features, where the platform builds predictive models from historical performance data, tend to sit behind the most expensive tiers. Additional costs stack up faster than the initial pricing suggests.
Ease of use tilts toward spreadsheets for most teams. Most marketers already know how Google Sheets works. There are no analytics platforms to connect, no API credentials to configure, no new marketing tools to learn. The key metrics and insights you get from well-built spreadsheets are the same ones dedicated marketing dashboard software surfaces. The difference is a few minutes of manual data entry each month instead of an automated pull.
For small businesses running a handful of channels, Google Sheets is the right call. If you are managing eight-figure ad budgets flowing from a dozen analytics platforms, purpose-built software earns its cost. This template is built for everyone else.
Marketing dashboard vs. KPI dashboard
This template focuses on marketing channel performance: spend efficiency, lead volume, conversion rates, and budget adherence. The KPI dashboard template covers business-wide performance across revenue, operations, HR, product, and customer KPIs.
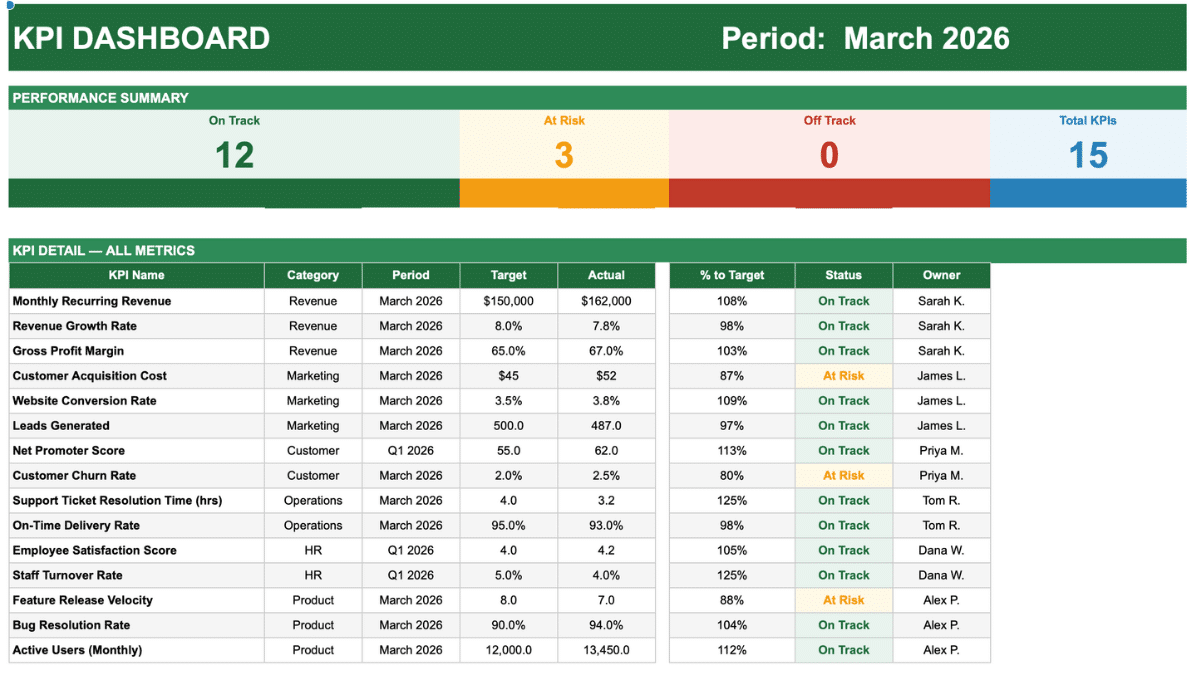
For most teams, both are useful. The marketing dashboard is the tool for weekly and monthly channel reviews. The KPI dashboard is the tool for cross-functional leadership reporting. They can share data. Your leads and CAC numbers from this template are the same inputs that feed the marketing KPIs on the broader dashboard.
If your marketing reporting also needs to show how campaigns are tracking against annual objectives, the OKR tracker template handles the strategic layer above both dashboards.
Marketing metrics dashboard vs. marketing channel scorecard
A marketing channel scorecard evaluates channels on a broader set of criteria: audience fit, content quality, competitive position, and strategic priority, alongside performance numbers. It is more of a diagnostic tool than a reporting tool. If you have done a January marketing audit, the channel scorecard is where that analysis lives.
This dashboard is built for ongoing operational reporting: what did each channel produce this month, how does it compare to last month, and are we on budget. The two tools answer different questions and work well together.
Frequently Asked Questions
Can I add more channels to the template?
Yes. Insert a row anywhere between rows 5 and 11 in the Channel Data tab. Copy the formatting and formulas from an adjacent row and enter the new channel name. Then update the SUM ranges in the totals row (row 12) and in the corresponding rows on the Marketing Dashboard tab to include the new row. The Instructions tab covers this in more detail.
How do I track channels that have no paid spend?
Set the Spend and Budget fields to zero for those channels. SEO, Email, Organic Social, and Direct are all set up this way in the sample data. You still enter impressions, clicks, and leads where applicable. The computed metrics section will calculate CTR and lead conversion rate for those channels even when spend is zero. CPL and ROAS will show blank for zero-spend channels since those metrics require a spend figure.
Can I use this template in Excel instead of Google Sheets?
Yes. The template is built in Excel-compatible format and opens in Excel without any issues. Formulas, conditional formatting, and dropdowns all work the same way. To use it in Google Sheets, upload the .xlsx file to Google Drive and choose to open it as a Google Sheet.
How often should I update the dashboard?
Most teams update channel data once a week or at the end of each month depending on reporting cadence. Paid channels with daily spend data are often worth reviewing weekly. SEO, email, and organic channels typically move more slowly and a monthly update is sufficient. The Monthly Trend tab is designed for end-of-month updates.
What is a good benchmark for blended CPL?
It depends heavily on your industry, deal size, and average close rate. B2B SaaS companies often see blended CPLs between $50 and $200. E-commerce companies typically work with lower CPLs because the conversion path is shorter. The more useful benchmark is your own historical CPL trend, whether it is moving up or down over time matters more than a generic industry number.
Can I share this dashboard with my team or clients?
Yes. In Google Sheets, use File, Share, and Share with others to give team members edit access or view-only access. For client reporting, you can share view-only access to just the Marketing Dashboard tab by hiding the other tabs before sharing. In Excel, share the file through OneDrive or as an attachment.
What is the difference between CPL and CPA?
CPL (cost per lead) measures the cost to acquire a lead, someone who has expressed interest but has not yet converted to a customer. CPA (cost per acquisition) measures the cost to acquire a paying customer. For most lead generation businesses, CPL is the primary marketing metric and CPA is a sales or revenue metric. This template uses CPL because the conversion from lead to customer happens outside most marketing channels.
How do I calculate ROAS if I do not track revenue by channel?
If your CRM or analytics platform does not attribute revenue to specific channels, leave the Revenue column blank for those channels. The ROAS formula will return a blank rather than an error. You can still use the template for all other metrics. For channels where you do have revenue data, typically email and sometimes paid search, enter it and the ROAS will calculate. Partial ROAS data is more useful than no ROAS data.
How does this compare to marketing dashboard software like Tableau or Power BI?
Dedicated marketing dashboard software like Tableau, Power BI, and Google Looker Studio connects directly to analytics platforms and automates data pulls. That automation has real value for large marketing teams managing many additional data sources. The tradeoffs are setup complexity, a steeper learning curve, and additional costs that scale with team size or features. For most small businesses and teams running a manageable number of channels, a well-structured Google Sheets dashboard delivers the same key metrics with significantly less overhead and no additional costs.