If gold surges in the first quarter of the year, real estate investors should brace for impact. That’s not a guess. It’s a trend grounded in nearly a decade of market data. From 2015 to 2025, excluding the anomalous COVID year of 2020, I analyzed how three key asset classes, gold, the Nasdaq, and the S&P 500, performed in Q1 and how U.S. home prices shifted in response. The takeaway? Gold rallies in Q1 often signal housing slumps in Q2.
Let’s get into the data.

Most people think of the housing market as being slow, local, and driven by fundamentals like supply, demand, and mortgage rates. And while those certainly play a role, we overlook how investor sentiment bleeds across markets. When fear creeps into equities, capital flees to safety. Historically, that safety has been gold.
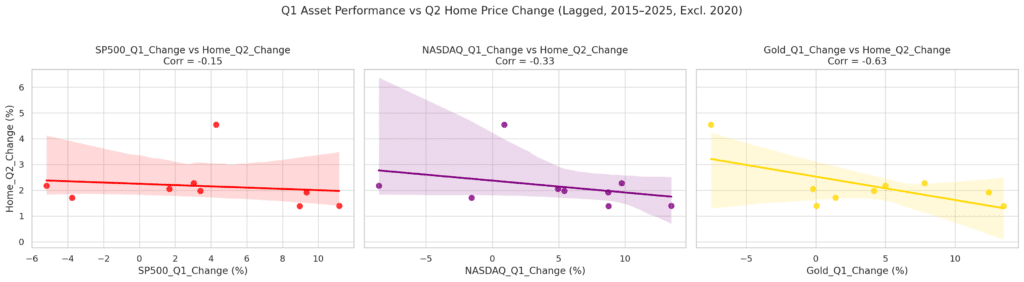
Here’s where it gets interesting: When gold rises early in the year, housing prices tend to fall soon after. Specifically, the correlation between Q1 gold gains and Q2 changes in U.S. home prices is –0.63, a strong negative relationship.
That means the more gold rallies in Q1, the more likely home prices will drop in Q2.
Gold doesn’t produce cash flow, and it doesn’t innovate. It exists to store value in times of fear. So when investors pour into gold, they’re not just hedging. They’re sounding the alarm. And the housing market listens.
Contrast that with tech. When the Nasdaq surges in Q1, housing prices often slump within the same quarter, with a -0.76 correlation. That suggests real estate buyers pull back when risk-on sentiment dominates. But, gold’s story is different. It doesn’t drag housing down in Q1. It delays the effect. It whispers, “Trouble’s coming.”
And if you think that’s interesting, take a look at what history tells us about presidents and the stock market.
Unlike stocks, you don’t buy a house with a click. Real estate is slower to react. That’s why I looked at Q1 asset performance versus Q2 housing data. When I did, the Nasdaq’s predictive power dropped. So did the S&P 500. But gold’s signal got stronger.
In short:
- A rising Nasdaq in Q1? Housing slows in Q1.
- A rising gold price in Q1? Housing slows in Q2.
Gold doesn’t react to excitement. It responds to anxiety. And that anxiety shows up in real estate just a few months later.
What This Means for Home Buyers (and Homeowners)
I’m not saying sell your home because gold ticked up. But if you’re timing a buy, evaluating market strength, or deciding when to list, these indicators matter. Think of them as sentiment signals. When investors flee to gold, they’re telling you they see risks, possibly in credit markets, inflation, or broader macroeconomic uncertainty.
And when they move like that en masse, the housing market tends to follow. Maybe not right away, but soon.
You don’t need to be a market timer to benefit from market timing. You just need to pay attention to the signals. Gold’s Q1 performance has been one of the more reliable leading indicators of housing weakness in Q2. And ignoring it could mean missing an opportunity or walking into a downturn.
So the next time you see headlines about gold breaking out in January or February, don’t just think about your portfolio. Think about your neighborhood. The data’s not perfect, but it’s consistent. And in real estate, consistency in timing is rare.
If you’re interested in analyzing data, learn Python. Get familiar with Pandas. Find the data sets you want to evaluate, then look for trends. That’s how you find a story!