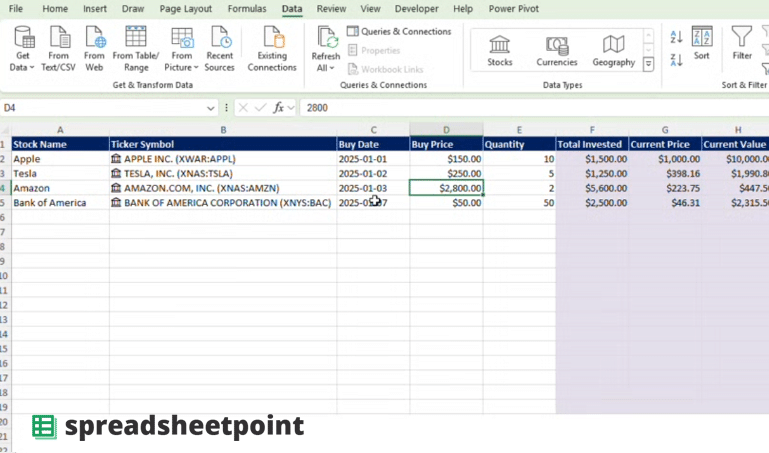
Tracking your stock portfolio effectively is crucial for understanding performance, identifying trends, and making informed investment decisions. Fortunately, Excel offers an excellent platform to build a custom portfolio tracker.
You can access our Excel stock tracker here (just make a copy for yourself).
Here’s a detailed breakdown of how to create one:
Step 1: Create the Structure
The foundation of any effective tracker lies in its structure. Start by creating a new Excel workbook and adding the following headers to Row 1:
- Stock Name (Column A): The name of the stock (e.g., Apple, Microsoft).
- Ticker Symbol (Column B): Stock market ticker symbol (e.g., AAPL, MSFT).
- Buy Date (Column C): Date you purchased the stock.
- Buy Price (Column D): Price per share at the time of purchase.
- Quantity (Column E): Number of shares purchased.
- Total Invested (Column F): The total amount invested.
- Current Price (Column G): The latest stock price.
- Current Value (Column H): The current value of your holdings.
- Gain/Loss ($) (Column I): Dollar amount of your profit or loss.
- Gain/Loss (%) (Column J): Percentage change in the value of your investment.
Step 2: Input Static Data
Now, populate the columns with information specific to your portfolio:
- Stock Names (Column A): Enter names such as “Apple” or “Microsoft.”
- Ticker Symbols (Column B): Input the respective stock ticker symbols.
- Purchase Date (Column C): Add the buy date for each stock.
- Buy Price (Column D) & Quantity (Column E): Fill in the price paid per share and the number of shares purchased.

Step 3: Add Formulas
To automate calculations, add these essential formulas:
- Total Invested (Column F):
=D2*E2
Calculates the total cost of buying the stock. - Current Value (Column H):
=G2*E2
Multiplies the current stock price by the number of shares. - Gain/Loss ($) (Column I):
=H2-F2
Computes the profit or loss in dollar terms. - Gain/Loss (%) (Column J):
=(I2/F2)*100
Shows the percentage change from the original investment.
Step 4: Fetch Current Prices
To keep your tracker dynamic, update the Current Price (Column G) regularly. Here are two methods:
- Using Excel’s Stock Data Type:
- Highlight the ticker symbols in Column B.
- Navigate to the Data tab and click on Stocks.
- Use the dropdown menu to populate the Current Price (Column G) automatically.
- Using Advanced Methods:
- Integrate APIs or use a VBA script to fetch live prices for real-time updates.

Step 5: Formatting and Visualization
Make your tracker visually intuitive:
- Number Formatting: Use currency formatting for price and total columns and percentage formatting for Gain/Loss (%).
- Conditional Formatting: Highlight gains in green and losses in red for quick visual insights.
- Summary Section: Add key metrics at the bottom or in a dedicated summary area:
- Total Portfolio Value:
=SUM(H2:H100) - Total Gain/Loss ($):
=SUM(I2:I100) - Total Gain/Loss (%):
=(SUM(H2:H100)-SUM(F2:F100))/SUM(F2:F100)*100
- Total Portfolio Value:
Step 6: Save and Update Regularly
Once your tracker is complete:
- Save the file in a secure location.
- Update Current Price (Column G) regularly for accurate portfolio monitoring.
Why Use an Excel Portfolio Tracker?
Creating a stock portfolio tracker in Excel offers unparalleled customization and control. While many apps provide pre-built tracking tools, Excel lets you tailor every detail to your needs. Whether you’re a beginner investor or a seasoned trader, this tracker gives you insights into your financial journey.
By following these steps, you’ll have a powerful tool to manage your investments efficiently. Whether you’re tracking a handful of stocks or managing a diversified portfolio, this Excel tracker ensures you stay on top of your financial goals.
Note that we also have a guide on how to import historical prices.