In a regulatory filing released late Friday, the investment giant revealed it purchased 17.8 million shares of Alphabet, Google’s parent company, during the third quarter. The purchase, valued at approximately $4.3 billion at the end of September, represents Berkshire’s largest stock addition for the period and sent Alphabet shares jumping 4% in after-hours trading.
The timing is striking given that financial markets have been consumed for months with anxiety about whether the artificial intelligence boom is actually a bubble waiting to burst. The question for the rest of us is simple: how do you track that kind of bet in a disciplined way, instead of reacting to every headline?
If you already live inside spreadsheets, the answer is straightforward. You build your own Buffett-style dashboard for the AI giants in Google Sheets. The benefit is simple. It forces investors to look at the numbers that matter: cash generation, capital spending, and balance sheet strength, not just stock price spikes. Here’s how to do it with Google Sheets.
Pick which AI companies to follow
Start with a basic list of companies at the center of the AI story. Put them on a sheet called Universe. Use columns for:
- Ticker
- Company
- Role in AI
- Notes
A starter list might include:
- GOOGL (Alphabet)
- MSFT (Microsoft)
- AMZN (Amazon)
- META (Meta Platforms)
- NVDA (Nvidia)
You can add others you think belong in the AI infrastructure or software stack. In “Role in AI,” write plain descriptions like “cloud and enterprise AI” or “chips for data centers.” The point is to remind yourself what each company actually does before you get lost in ratios.
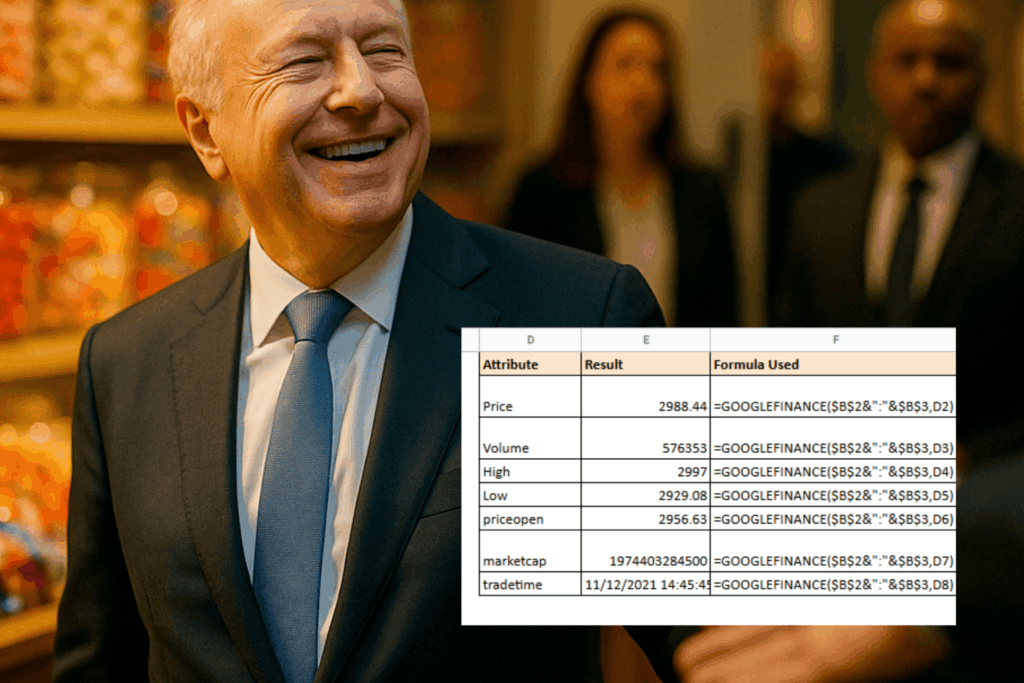
Pull live data with GOOGLEFINANCE
Next, build a Market Data sheet and connect it to real prices.
Create columns for:
- Ticker
- Price
- Market cap
- P/E
- EPS
Reference the tickers from your Universe sheet, then use the
GOOGLEFINANCE function to pull in live data for each one. With a few formulas, you will have an automatically updating snapshot of the AI names Buffett is implicitly choosing among when he buys Alphabet instead of something else.

It is a small step, but it already puts you ahead of investors who only look at a single stock in isolation.
Add the fundamentals Buffett actually cares about
Price and P/E tell you what the market thinks right now. Buffett has spent decades repeating that he cares more about durable earnings, free cash flow, and sensible capital allocation.
So add more columns for:
- Revenue (trailing twelve months)
- Free cash flow (ttm)
- Capital expenditures (ttm)
- Total debt
- Shareholders’ equity
You can fetch these from annual reports, 10-Ks, or any financial data source you trust. Updating them once a quarter is enough to keep your sheet useful. This is also a good spot to add any other reported facts you want to track.
Turn raw numbers into value-investor metrics
Now use a few simple formulas to convert that raw data into checks a value investor would recognize.
Free cash flow yield is one of them. Divide free cash flow by market cap and format it as a percentage. All else equal, a higher number means you are getting more cash for every dollar of company value.
Capex as a share of revenue tells you how capital hungry the business has become in the AI arms race. Heavy spending might be justified, but you do not want to ignore it.
Debt to equity gives you a quick sense of leverage. In a world where AI data center spending is measured in trillions of dollars, it matters whether a company funds that mostly from cash flow or mostly from borrowing.
You can even create a simple “quality score” that rewards higher free cash flow yield and penalizes very high capex or leverage. It will not be perfect, but it will give you a consistent way to compare companies side by side.
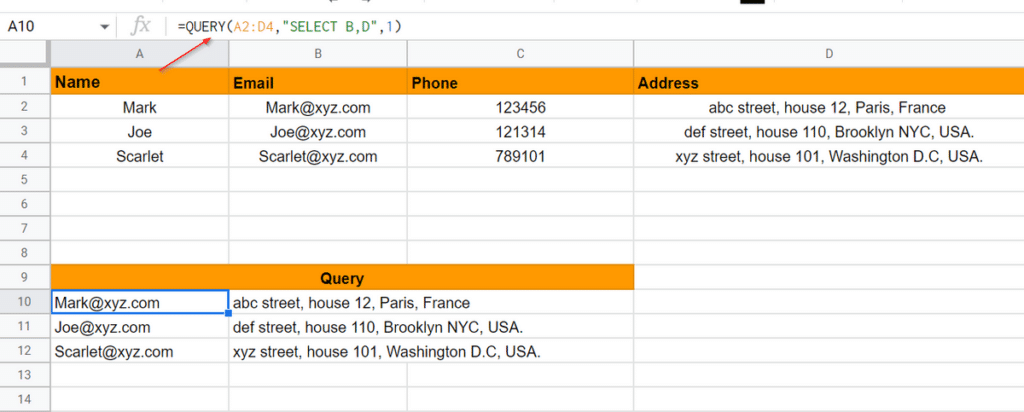
Let Google Sheets build a shortlist for you
Once the metrics are in place, you do not need to eyeball every line. You can let the sheet surface candidates that fit a Berkshire-style profile.
Use the
QUERY function on your Market Data sheet to filter for companies with:
- Free cash flow yield above a threshold you are comfortable with
- Capex below a certain share of revenue
- Debt that is not out of proportion to equity
Sort the results by your quality score. The output is a shortlist of AI names that look more like long-term compounders and less like speculative lottery tickets.
This is where Alphabet ends up if you agree with Buffett’s view. It is also where some of its peers could fail the test.
A sheet like this will not tell you with certainty whether AI spending is rational or a bubble. Analysts will keep debating whether three trillion dollars of data center investment through 2028 makes sense. Markets will swing around earnings calls and headlines.
The dashboard does something quieter and more useful.
It forces you to:
- Look past the narrative and check free cash flow
- Track how much each company burns to stay in the AI race
- Watch leverage instead of ignoring the balance sheet
- Compare AI giants using one consistent lens
Buffett’s decision to buy Alphabet does not require you to follow him. But if you are going to have an opinion on the AI boom at all, building this kind of spreadsheet is a better starting point than another viral chart on social media.
Open the file, let the data refresh, and see which companies still look like something a long-term investor would want to own.
The takeaway here is simple. And it goes beyond a traditional Google Sheets investment tracker spreadsheet.
Alphabet stands at the forefront of the AI arms race alongside Amazon, Meta, and Microsoft. These tech giants are collectively spending hundreds of billions of dollars annually on data center infrastructure and AI development, with no signs of slowing down. Morgan Stanley estimates that AI hyperscalers plan to invest roughly $3 trillion on data centers and related infrastructure through 2028.
This relentless capital spending, much of it financed through debt, has made investors nervous about whether these companies can actually convert their massive outlays into sustainable profits. Yet Buffett’s move suggests confidence that Alphabet, at least, will succeed in that conversion. The stock has already surged 46% this year despite recent market turbulence.
In the end, what Buffett did with Alphabet is just a visible version of a choice every investor has to make: whether to treat the AI boom as a story or as a set of numbers you can test. A simple Google Sheets dashboard can anchor your thinking in free cash flow, capex, and leverage instead of vibes.
If you keep that file updated and let the formulas do their work, you will have a clearer view of which AI giants look like durable businesses and which ones are just riding the wave.