On the surface, comparing gold and Illinois housing may seem like an apples-to-oranges exercise. One is a globally traded commodity, the other a slow-moving regional market grounded in local economics. But a decade’s worth of data, stripped of the outlier year of 2020, reveals a surprising pattern: Q1 gold performance may offer a preview of what’s coming for the Illinois housing market in Q2.
This isn’t a perfectly linear relationship, but when spot gold prices trend upward in the first quarter of the year, Illinois median home prices in the second quarter tend to follow suit. And when gold falters early in the year, housing prices often cool off soon after. Over time, the signal emerges with enough consistency to merit attention.
This is a deeper look into our findings that Q1 gold prices predict the direction of the Q2 housing market. Data supports the point, though it isn’t as cut and dried as you might think.
Gold Leads, Housing Follows?
Consider the bookends of the timeline. In Q1 2014, gold suffered a steep drop. Spot prices in January were down over 25 percent year over year, reflecting a sharp correction following the post-recession highs of 2011 and 2012. That spring, Illinois housing still posted solid gains, but they were moderate by comparison. April and May saw year-over-year price growth between 7 and 8 percent.
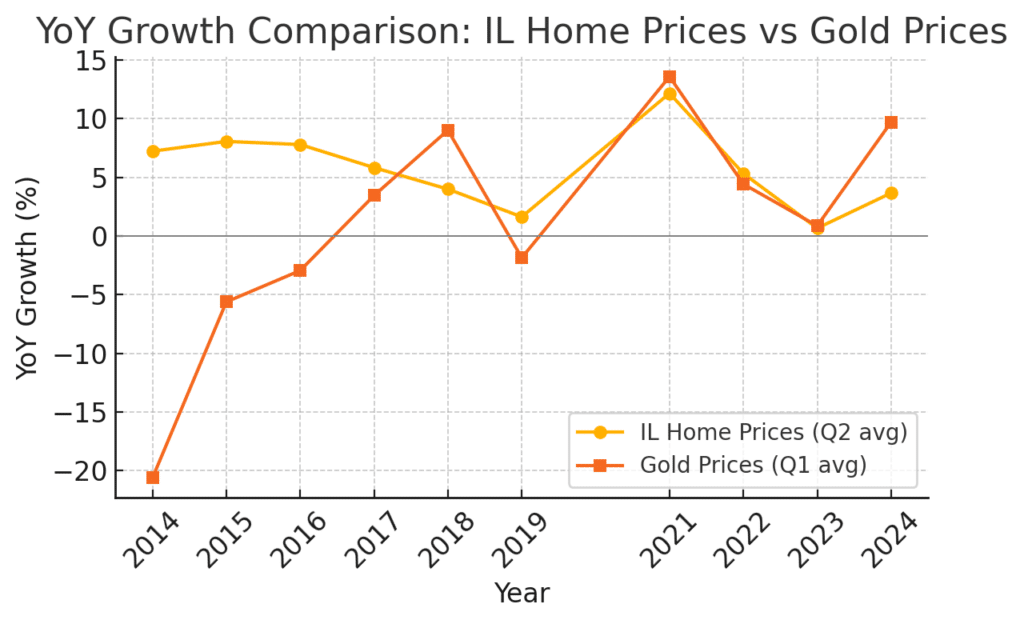
The trend repeated in early 2015. Gold stayed flat to slightly negative, and Q2 housing growth in Illinois remained in the 7 to 8 percent range. This was not a collapse, but not an acceleration either.
In 2016, gold began to tick up. March of that year saw a positive 5.6 percent year-over-year gain. A few months later, Illinois real estate posted one of its best quarters of the decade, with April home prices rising more than 10 percent year over year.
By the time gold peaked again in Q1 2021, the correlation was even more striking. Spot prices rose nearly 20 percent in January and remained elevated through March. In Q2, Illinois housing followed with its own dramatic surge. April prices jumped 14.5 percent over the previous year, and double-digit growth continued into June.
Correlation or Coincidence?
To be clear, this relationship is far from perfect. There were years when the signal diverged. For example, in Q1 2018, gold prices rose by double digits in January, yet Illinois housing gains (according to Redfin) that spring were moderate, hovering around 4 to 5 percent. Similarly, Q1 2022 showed mixed gold performance, with March up 13 percent year over year, but housing growth in Q2 was already beginning to cool.
And the Illinois market doesn’t match what we see nationally. In years like 2016, 2017, and 2023, gold surged, and home price gains in Q2 were relatively tame.
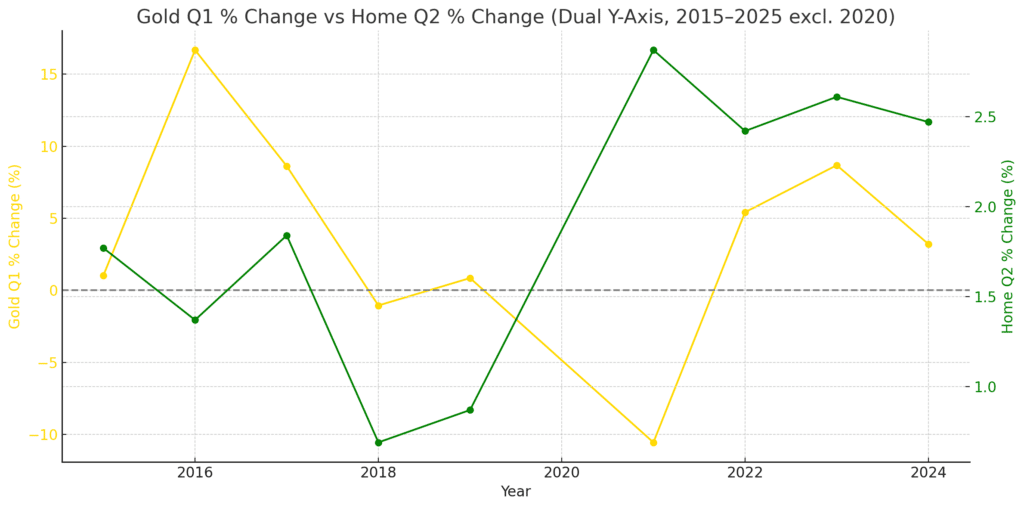
Still, the broader trend holds. Positive momentum in gold prices early in the year tends to be followed by at least modest strength in the housing market shortly after. It is not a one-to-one predictive model, but it raises a compelling question.
Why would gold, of all things, serve as a bellwether for housing?
One explanation may lie in psychology and macroeconomics. Gold is often an early responder to shifts in inflation expectations, interest rate policy, and investor confidence. When gold prices rise sharply in Q1, it may indicate that investors expect financial conditions to loosen or inflation to rise. Both of these outcomes tend to stimulate home buying demand in the months that follow.
In contrast, when gold stagnates or falls, it can signal economic uncertainty or tightening financial conditions, which often spill over into the housing market by late spring.
Illinois housing is particularly sensitive to these dynamics. Compared to hot coastal markets, it moves more slowly and aligns more closely with broader economic forces. That makes it more likely to follow trends set in motion by financial signals like gold.
What It All Means
For homeowners, investors, and real estate professionals, the gold-housing connection may serve as one more tool in the forecasting toolkit. It is not precise, but it does offer a potential early indicator.
In 2024, gold prices surged again in Q1. March spot prices were up nearly 13 percent over the prior year. If the historical pattern holds, that could suggest Illinois home prices will see moderate gains in Q2, a welcome shift after the near-zero growth seen in 2023.
As always, the past is no guarantee of the future. Macroeconomic variables, interest rates, and local inventory levels all play a role. Still, the data presents a fascinating narrative. The housing market may not be as insulated from global commodities as we once thought.
And if you’re interested in this kind of data, check out our recent article on how eggs would have been the best investment of the past five years.